The campaign adds to Kidoodle.TV’s growing legacy of family-focused impact, from supporting wishes to feeding families, and more.
CALGARY, AB / ACCESS Newswire / August 7, 2025 / Kidoodle.TV, the Safe Streaming™ service owned by A Parent Media Co. Inc. (APMC) and trusted by millions of families around the world, has completed its “A Wish A Week” commitment in partnership with Make-A-Wish® Metro New York. The initiative, which granted one wish per week for 52 weeks, culminated in a heartwarming on-platform celebration showcasing the creativity and courage of the incredible kids behind the wishes.
To mark the close of the campaign, Kidoodle.TV invited Wish Kids to take the spotlight by curating personalized playlists of their favorite shows on Kidoodle.TV, complete with custom video introductions to share a bit of who they are with fellow viewers. These unique, kid-powered playlists ran for eight weeks, serving as a joyful tribute to bravery, imagination, and individuality.
Throughout the year, Kidoodle.TV brought attention to a variety of magical wish moments on its social media platforms, from fashion shows and superhero adventures to unforgettable family trips and celebrity meetups, shining a light on the power of a wish and the hope it brings to children and families facing critical illness.
“This campaign wasn’t just about fulfilling wishes, it was about showing kids that their stories matter. As a family-first company, we believe in putting action behind our values; that means celebrating courage, supporting communities, and using our reach to bring joy into as many homes as possible,” said Neil Gruninger, President and CEO of APMC.
“Working with Make-A-Wish Metro New York in such a significant way was a reflection of who we are as a company,” said Lindsay Dobson, SVP of Marketing & Social Impact at APMC. “At our core, we believe that media can do more than entertain; it can uplift, connect, and bring meaningful joy to families when they need it most. Supporting these incredible kids and sharing their stories through our platform is one of the most impactful ways we can live out our mission.”
Maureen Fitzgerald, Chief Development Officer at Make-A-Wish Metro New York, added, “What an honor it’s been to work together with the team at Kidoodle.TV to highlight how special our wish kids are. Kidoodle.TV supported the wish journeys of so many children and truly leaned into showcasing how each child’s heartfelt wish can bring hope, joy, and healing in the face of critical illness. Our shared commitment to kids and families was celebrated throughout the partnership and Make-A-Wish is so deeply grateful.”
The “A Wish A Week” initiative is part of Kidoodle.TV’s long-standing commitment to giving back to the families it serves. From launching the KidoodlED Million Dollar School Giveaway, to monthly grocery relief through its Feeding Families program, to supporting organizations like Baby2Baby that help children living in poverty, Kidoodle.TV continues to go beyond entertainment, building a culture of care and contribution.
A Parent Media Co. Inc. (APMC) is a media and technology company focused on providing innovative solutions to consumers and brands. APMC is a leader in Safe Streaming™ delivering an end-to-end solution to brands and platforms with an emphasis on unlocking incremental revenue. Utilizing proprietary streaming and monetization technologies, APMC reaches millions of homes globally through its products including Kidoodle.TV®, Dude Perfect Streaming Service, Glitch+™, Victory+™ and Safe Exchange™. Kidoodle.TV is a Safe Streaming™ service committed to providing children with a safe alternative to stream their favorite TV shows and movies. Available in over 160 countries and territories on thousands of connected devices, Kidoodle.TV provides peace of mind, with every show* vetted by caring people who are committed to Safe and Free Streaming for Kids™. Kidoodle.TV is available on iOS, Android, Apple TV, Fire TV, LG, Samsung, VIDAA-enabled Hisense TVs, Chromecast, Roku, Vizio SmartCast Amazon, Jio, Xfinity X1, Connected TVs, HTML5 Web, and many other streaming media devices, including Miko 3. Kidoodle.TV is certified by the kidSAFE® Seal Program and is the proud recipient of the Mom’s Choice Award®, a Stevie® Award, platinum winner of the Best Mobile App Award, and Parents’ Picks Award – Best Elementary Products. Visit www.kidoodle.tv to learn more.
About Make-A-Wish Metro New York and Western New York
Make-A-Wish creates life-changing wishes for children with critical illnesses. The organization seeks to bring every eligible child’s wish to life because a wish is an integral part of a child’s treatment journey. Research shows children who have wishes granted can build the physical and emotional strength they need to fight their illness. Since 1983, Make-A-Wish Metro New York and Western New York has fulfilled the wishes of over 19,000 children in the communities they serve: New York City, Long Island and 17 counties in the Buffalo and Rochester areas. For more information, please visit www.wish.org/newyork.
NEWMARKET, ON / ACCESS Newswire / August 7, 2025 / Consumer Choice Award is pleased to announce the 2025 award recipients in the York Region. These businesses have been meticulously selected through independent market research, reflecting their commitment to excellence and unparalleled service in their city. Consumer Choice Award celebrates those who have consistently set the benchmark for quality and customer satisfaction. Congratulations to the 2025 York Region Consumer Choice Award Winners.
Learn more about 2025 York Region Consumer Choice Award Winners HERE.
About Consumer Choice Award: Consumer Choice Award has been recognizing and promoting business excellence in North America since 1987. Its rigorous selection process ensures that only the most outstanding service providers in each category earn this prestigious recognition. Visit www.ccaward.com to learn more.
Dallas College hosted ACE for a signing ceremony on Wednesday, Aug. 6
INDIANAPOLIS, IN / ACCESS Newswire / August 7, 2025 / American College of Education® (ACE) and the Dallas College School of Health Sciences signed an agreement on Wednesday, Aug. 6, benefitting nursing students looking to take their careers to the next level. The new pathway options allow Bachelor of Science in Nursing (BSN) students and graduates at Dallas College to work toward a Master of Science in Nursing (MSN) at ACE faster and at a lower cost.
Earned credits in Dallas College’s BSN program are now automatically applicable to ACE’s MSN, an opportunity available to both current students and graduates. Additionally, current BSN students can take courses concurrently at ACE, allowing them to have just 13 remaining credits to complete the MSN once they graduate from Dallas College.
“At ACE, we are rolling up our sleeves to create solutions that address today’s nursing shortage crisis,” ACE President and CEO Geordie Hyland said. “We’re excited to expand our partnership with Dallas College and see nurses become the leaders our healthcare landscape needs in less time and at affordable costs.”
The organizations’ partnership originated in 2021 with a transfer agreement. Their collaboration grew in 2024 to include specialized education pathways for healthcare professionals and now, nurses.
“We are proud to deepen our collaboration with ACE through this new concurrent enrollment agreement,” said Dr. Shawnda Floyd, Dallas College provost and vice chancellor of workforce education. “This pathway empowers our nursing students and graduates to seamlessly advance their education, strengthen their clinical and leadership skills and ultimately improve healthcare outcomes across the communities we serve.”
Hyland, Floyd, ACE Assistant Provost of Healthcare Professions Dr. Luster Fowler and other Dallas College employees were in attendance at the signing held at Dallas College.
About American College of Education
American College of Education (ACE) is an accredited, fully online private college specializing in high-quality, affordable programs in education, business, healthcare and nursing. Headquartered in Indianapolis, ACE offers more than 60 innovative and engaging programs for adult students to pursue a doctorate, specialist, master’s or bachelor’s degree, along with graduate-level certificate programs.
About Dallas College
Celebrating its 60th anniversary in 2025, Dallas College consists of seven campuses – Brookhaven, Cedar Valley, Eastfield, El Centro, Mountain View, North Lake and Richland – plus a dozen centers located throughout Dallas County. As one of the largest community colleges in the U.S., Dallas College offers online and in-person learning, serving more than 127,000 credit, workforce and continuing education students annually. Students benefit from partnerships with local school districts, four-year universities, industry and community leaders. Dallas College offers associate degrees and career/technical certificate programs in more than 100 areas of study, as well as bachelor’s degrees in education, nursing and software development. As the largest provider of dual credit in Texas, Dallas College serves 30,000 high school students through 63 dual credit programs.
Teaching non-technical founders the new way to build
AUSTIN, TEXAS / ACCESS Newswire / August 7, 2025 / V Codinator, dubbed the “Duolingo of Vibe Coding,” is changing how non-technical founders build MVPs by simplifying complex tech development into accessible, actionable steps. Instead of spending months and thousands of dollars hiring developers, users quickly learn to build websites, mobile apps, and full-stack applications with the same AI-assisted tools used by leading tech companies.
Co-founded by Jack, who once struggled as a non-coding founder, and Eli Serrano, a developer building software since age 9, V Codinator helps users master prompt engineering-using carefully designed instructions to guide AI tools in creating functional code.
“Our users don’t want coding classes-they want to build. We make that happen fast,” said Jack. “Cody, our AI assistant, teaches users precisely how to prompt AI to produce working code in minutes, turning weeks or months of work into days.”
The platform’s interactive learning features include:
Duolingo-Style Lessons: Short, engaging modules and quizzes that build practical coding skills quickly, designed specifically for busy founders.
Prompt Playground: Hands-on practice writing effective AI prompts using Cursor, Lovable, and V0, powerful tools that significantly speed up the coding process.
Beginner Docs: Clear, structured guides for building Web (React, Next.js), Mobile (React Native), Backend Infrastructure, and full-stack apps, covering everything you need to know in the Vibe stack.
Users have already built successful products, including cross-platform mobile apps, professional-grade websites and secure full-stack business applications, often within just weeks of starting the course.
“Founders turn ideas into functional, market-ready products without becoming full-time coders,” Eli explained. “We’re removing the technical barriers that previously slowed down or stopped early-stage founders.”
V Codinator’s community further supports rapid learning by offering live assistance, project feedback, and networking opportunities with other founders and developers.
V Codinator is an interactive vibe-coding education platform empowering non-technical founders to quickly build software products using AI-assisted tools and prompt engineering. Combining Duolingo-inspired interactive lessons, beginner docs, and personalized AI guidance from Cody, the platform makes complex software development accessible, enabling users to rapidly launch real products without coding directly. Visit www.vcodinator.com to learn more.
130+ Public Companies | $18B Avg. Market Cap | 3,700 Investor Meetings Expected
NEW YORK CITY, NY / ACCESS Newswire / August 7, 2025 / Seaport Research Partners (SRP), a rapidly expanding and innovative sell-side equity research platform, announced its Annual End of Summer Investor Conference, taking place virtually on August 19th and 20th.
Since its formation in 2021, the SRP research team has grown to 27 senior analysts and strategists covering 10 sectors and over 60 industries, solidifying its position as the premier destination for top-tier independent equity research professionals.
Recently, the firm announced Jonathan Golub and Patrick Palfrey, multi-year Institutional Investor – ranked strategists, ranking in four separate categories joined the platform as Chief Equity Strategist and Head of Portfolio Strategy. Both were previously at UBS and Credit Suisse. Jonathan Golub also served as the voice of JP Morgan Funds.
This year’s event will host 130+ publicly traded companies with an average market cap of $18 billion, representing key sectors such as Consumer, Energy, Financials, Industrials, Materials, Technology, Utilities, and more.
SRP’s flagship conference is designed to foster meaningful engagement between corporate leadership and institutional investors, featuring 1x1s, small-group meetings, and analyst-led sessions – all exclusive (no public webcasts).
The 2024 conference welcomed over 1,000 participants and facilitated more than 3,700 curated meetings. This year’s program is expected to build on that success, offering a high-impact, insight-driven forum for idea exchange and investor connectivity.
Participation is by invitation only. For access, please contact your Seaport representative. SRP Corporate Access team offers a premier full slate of Multi-Sector, Sector Specific Conferences, Industry Expert & Private Events, Interactive Field Trips, and much more.
About Seaport Research Partners
Seaport Research Partners (SRP) is redefining the face of equity research by combining institutional pedigree with startup agility.
Since formation, in 2021, SRP has added 27 senior equity analysts/strategists to its research team. SRP now provides coverage of more than 10 sectors and 60 industries. SRP’s professionals average 20 years’ experience, most with prior experience at bulge bracket firms and many with industry recognitions such as II rankings.
SRP is committed to acquiring top-ranked Analysts across industry sectors. Through an innovative business model, SRP empowers self-driven analysts by reshaping economics and delivering a fully integrated solution to support, enhance, and grow their franchise.
SRP operates as a registered investment advisor and a broker dealer as a division of Seaport Global Securities (SGS). The SGS platform provides established global client relationships. SGS’ more than 200 sales and trading professionals cover over 4,000 institutional accounts across the capital structure, including asset management, global equity and debt capital markets. The firm also provides a full suite of corporate access services encompassing multi-sector and sector-specific conferences, fixed income and derivatives research, and investment banking. SGS has offices throughout the US, as well as in London, Hong Kong and Dubai. For more information, visit www.seaportrp.com.
Contact Justin Cable Seaport Research Partners 949.274.8052 hello@seaportrp.com
Sport-Inspired Brand Recognized for Reaching $2.5 Billion in Global Retail Sales in 2024
WEST PALM BEACH, FLA. / ACCESS Newswire / August 7, 2025 / USPA Global today announced that U.S. Polo Assn., the official brand of the United States Polo Association (USPA), has once again been ranked in the Top 25 on License Global magazine’s list of Top Global Licensors for 2025, and is now ranked the No. 1 sports brand on the prestigious list. Recognized as one of the world’s largest sports and apparel licensors, U.S. Polo Assn. remains in the 23rd position overall, alongside other high-profile sport brands, such as the NFL Players Association, Formula 1, and the PGA Tour.
U.S. Polo Assn.’s authentic connection to the sport of polo continues to resonate with younger consumers and sports fans around the world, contributing to the brand’s No. 1 sports brand ranking and position within the Top 25 of the Top Global Licensors list for three consecutive years. The sports brand’s strong ranking for this year was based on delivering a record-breaking $2.5 billion in global retail sales in 2024. U.S. Polo Assn.’s worldwide footprint includes over 190 countries in more than 1,100 U.S. Polo Assn. stores, thousands of additional retail locations, more than 12 million social media followers, and over 50 e-commerce sites in 20 languages.
“Earning the No. 1 sports brand ranking while remaining at 23rd on License Global‘s Top Licensors list is a powerful validation of our global brand strategy and the tireless work of our USPA Global Team as well as worldwide strategic partners,” said J. Michael Prince, President and CEO of USPA Global, the company that manages and markets the multi-billion-dollar U.S. Polo Assn. brand. “To be ranked alongside some of the most iconic names in sports and fashion reinforces our position as a top-performing global brand with an authentic connection to sport, style, and consumers around the world.”
License Global‘s Top Global Licensors list is a “who’s who” of licensing titans, derived from an annual study that “accounts for retail sales of licensed merchandise across all major sectors of business, from entertainment to sport, food and beverage, corporate brands, fashion, art and design, and much more.”
“U.S. Polo Assn. being recognized as the No. 1 sports brand in this year’s ranking in the Top Licensors list from License Global is a direct reflection of the trusted relationships we have built with our strategic global partners,” said Molly Robbins, SVP of Global Licensing and Business Development for USPA Global. “Our strategic focus on collaborative growth, product excellence, and consistent brand storytelling continues to fuel our momentum and drive long-term success in key markets worldwide.”
To be considered for inclusion, each brand or corporate entity must submit retail figures based on worldwide sales of licensed merchandise. In addition, License Global‘s editors do their own independent vetting and verification by consulting industry sources, annual reports, and financial documents. The world’s largest brand remains The Walt Disney Company at $62 billion in retail sales, with the fourth largest brand, NBC Universal, at $17 billion, and Warner Bros. Discovery, the sixth largest brand, at $15 billion.
“Looking ahead, I’m very optimistic about U.S. Polo Assn.’s global growth potential. We are on track to surpass $3 billion in sales in the near future and continue to open more store locations in both existing regions and exciting new markets,” added Prince.
About U.S. Polo Assn. and USPA Global
U.S. Polo Assn. is the official brand of the United States Polo Association (USPA), the largest association of polo clubs and polo players in the United States, founded in 1890 and based at the USPA National Polo Center in Wellington, Florida. This year, U.S. Polo Assn. celebrates 135 years of sports inspiration alongside the USPA. With a multi-billion-dollar global footprint and worldwide distribution through more than 1,100 U.S. Polo Assn. retail stores as well as thousands of additional points of distribution, U.S. Polo Assn. offers apparel, accessories, and footwear for men, women, and children in more than 190 countries worldwide. Historic deals with ESPN in the United States and Star Sports in India now broadcast several of the premier polo championships in the world, sponsored by U.S. Polo Assn., making the thrilling sport accessible to millions of sports fans globally for the very first time.
U.S. Polo Assn. has consistently been named one of the top global sports licensors in the world alongside the NFL, NBA, and MLB, according to License Global. In addition, the sport-inspired brand is being recognized internationally with awards for global and digital growth. Due to its tremendous success as a global brand, U.S. Polo Assn. has been featured in Forbes, Fortune, Modern Retail, and GQ as well as on Yahoo Finance and Bloomberg, among many other noteworthy media sources around the world.
USPA Global is a subsidiary of the USPA and manages the global, multi-billion-dollar U.S. Polo Assn. brand. Through its subsidiary, Global Polo Entertainment (GPE), USPA Global also manages Global Polo TV, which provides sports and lifestyle content. For more sports content, visit globalpolo.com.
Technical Report Underscores Large, Multi-generational High-Grade Colemanite Deposit to Support Domestic Supply of Boron Amid Growing Demand
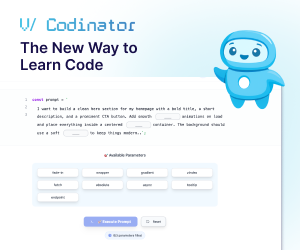
HESPERIA, CALIFORNIA / ACCESS Newswire / August 7, 2025 / 5E Advanced Materials, Inc. (“5E” or the “Company”) (Nasdaq:FEAM)(ASX:5EA), a boron and lithium company designated as Critical Infrastructure by the U.S. Department of Homeland Security, is developing one of the world’s largest new conventional boron deposits through a vertically integrated platform, is pleased to announce the completion of the Preliminary Feasibility Study (the “Technical Report”) for the Company’s Fort Cady Project (the “Project”) located in the Mojave Desert, near the town of Newberry Springs, California.
The Project underpins 5E’s strategy to become a vertically integrated global supplier of critical and industrial materials through in-situ extraction of colemanite, from which the Company intends to produce boron and calcium-based products which will support global electrification, energy, food security, and critical defense applications.
Highlights of the Pre-Feasibility Study
Technical Report is specifically focused on Phase 1 of the Project, converting 41% of the resource into 5.4M tons of boric acid (H3BO3) reserves yielding 39.5-year life of mine
Total Mineral Reserves of 5.4M tons boric acid with grade of 8.03% (B2O3)
Technical Report ONLY includes Phase 1 production and presents robust economics with forecasted pre-tax net present value (NPV7) of US$724.8 million and 19.2% unlevered IRR
Project retains optionality for future expansion phases of additional production tonnage and value-added boron derivatives
The initial Phase 1 plant targets delivery of 130,000 tons per year of boric acid production, approximately ~11% of global boric acid demand today
Mining permits in place with the colemanite reserve mined using an in-situ leaching (“ISL”) method, thereby minimizing the surface land disturbance required for the Project facilities
The expected initial project capital cost (inclusive of a gas COGEN facility) is US$367M for Phase 1 plus US$55M contingency (15%) and US$13M of owner’s cost
By-product mix includes calcium chloride and gypsum with expected all-in sustaining cash (including logistics) of US$554.80 per ton of boric acid
Market study indicates tight supply with demand forecasted to exceed supply in 2026 driving boric acid prices higher
Revenue from production will primarily be derived from boric acid sales, approximately 94% of total revenue, while by-products of calcium chloride and gypsum will provide approximately 6% of total revenue
The Technical Report, which outlines an initial mine life of 39.5 years, confirms the strong economics of an ISL operation that would initially produce 130,000 short tons per year of boric acid along with calcium-based by-products; calcium chloride and gypsum. This Technical Report only includes Phase 1 of the Project, with optionality for phased expansion of additional tonnage and value-added boron derivatives.
The Company commenced mining operations in January 2024 and currently has a small-scale facility (“SSF”) that began operation in April 2024, which has provided invaluable operational data that has been incorporated into the basis of design for the Project. The SSF has achieved a steady state of production for boric acid and gypsum in addition to qualifying 14 customers who have set the stage for continued offtake negotiations. Most recently, two injection-recovery wells were converted to horizontal wells intercepting approximately 3,000 feet of high-grade colemanite.
“This technical report validates the economic strength and strategic importance of the Fort Cady Project,” stated Mr. Paul Weibel, Chief Executive Officer of 5E Advanced Materials. “With strong projected economics underpinned by meticulous technical work, we are now positioned to move into definitive feasibility planning, FEED-engineering and long-term project financing with the right team who have been critical in reaching this point in the development cycle. I am very pleased with 5E’s team and partners work to deliver this report. We have mined and processed for the last 18-months and have qualified product with over 14 large global end users. As we target large-scale commercial production in 2028, we look toward the economic potential of the Project, which we expect will provide high paying jobs in California and be a significant long-term U.S. producer of boron to maintain the security of the boron supply chain in the United States.”
5E will host a conference call to discuss the results of the Technical Report on Tuesday, August 12, 2025, at 5:00 p.m. EDT (2:00 p.m. PDT). The call will be hosted by 6ix with remarks from Mr. Paul Weibel, Chief Executive Officer of 5E Advanced Materials, Inc.
The Technical Report summary results are presented in Table 1.
Table 1. Project Summary
Description
Units
Total/Amount
Mine Life
Years
39.5
Reserves B2O3 (tonnage)
Tons (short)
3,003,955
Reserves H3BO3 (tonnage)
Tons (short)
5,335,023
Reserves B2O3 (grade)
%
8.03%
Recovery B2O3 (in-situ)
%
81.9%
Mining Efficiency (drilling)
%
95.0%
Recovery B2O3 (processing)
%
95.1%
Table 1. Project Summary (Continued)
Production
Annual Production (H3BO3)
Tons (short) per year
130,000
Annual Production (Gypsum)
Tons (short) per year
129,000
Annual Production
(CaCl2 ~ 38%)
Tons (short) per year
57,000
Capital Costs
Initial Capital with Contingency
$M USD
435.0
Sustaining Capital
$M USD
39.9
Total Capital (life of mine)
$M USD
474.8
Operating Costs (Full-Run Rate)
Variable Costs
$/t H3BO3
405.7
Fixed Costs
$/t H3BO3
222.1
Credits
$/t H3BO3
(73.0)
Net Total Costs (inclusive of logistics)
$/t H3BO3 (net)
554.8
Economic Analysis
Average Price LOM – H3BO3
$/short ton
1,355
Netback Price – Gypsum
$/short ton
21
Netback Price – CaCl2 ~38%
$/short ton
120
Pre-Tax: Free Cashflow
$M USD
3,749
Pre-Tax: NPV7
$M USD
725
Pre-Tax: IRR
%
19.2
After-Tax: Free Cashflow
$M USD
2,625
After-Tax: NPV7
$M USD
469
After-Tax: IRR
%
15.9
After-Tax: Payback Period
Years
5.9
Project Location
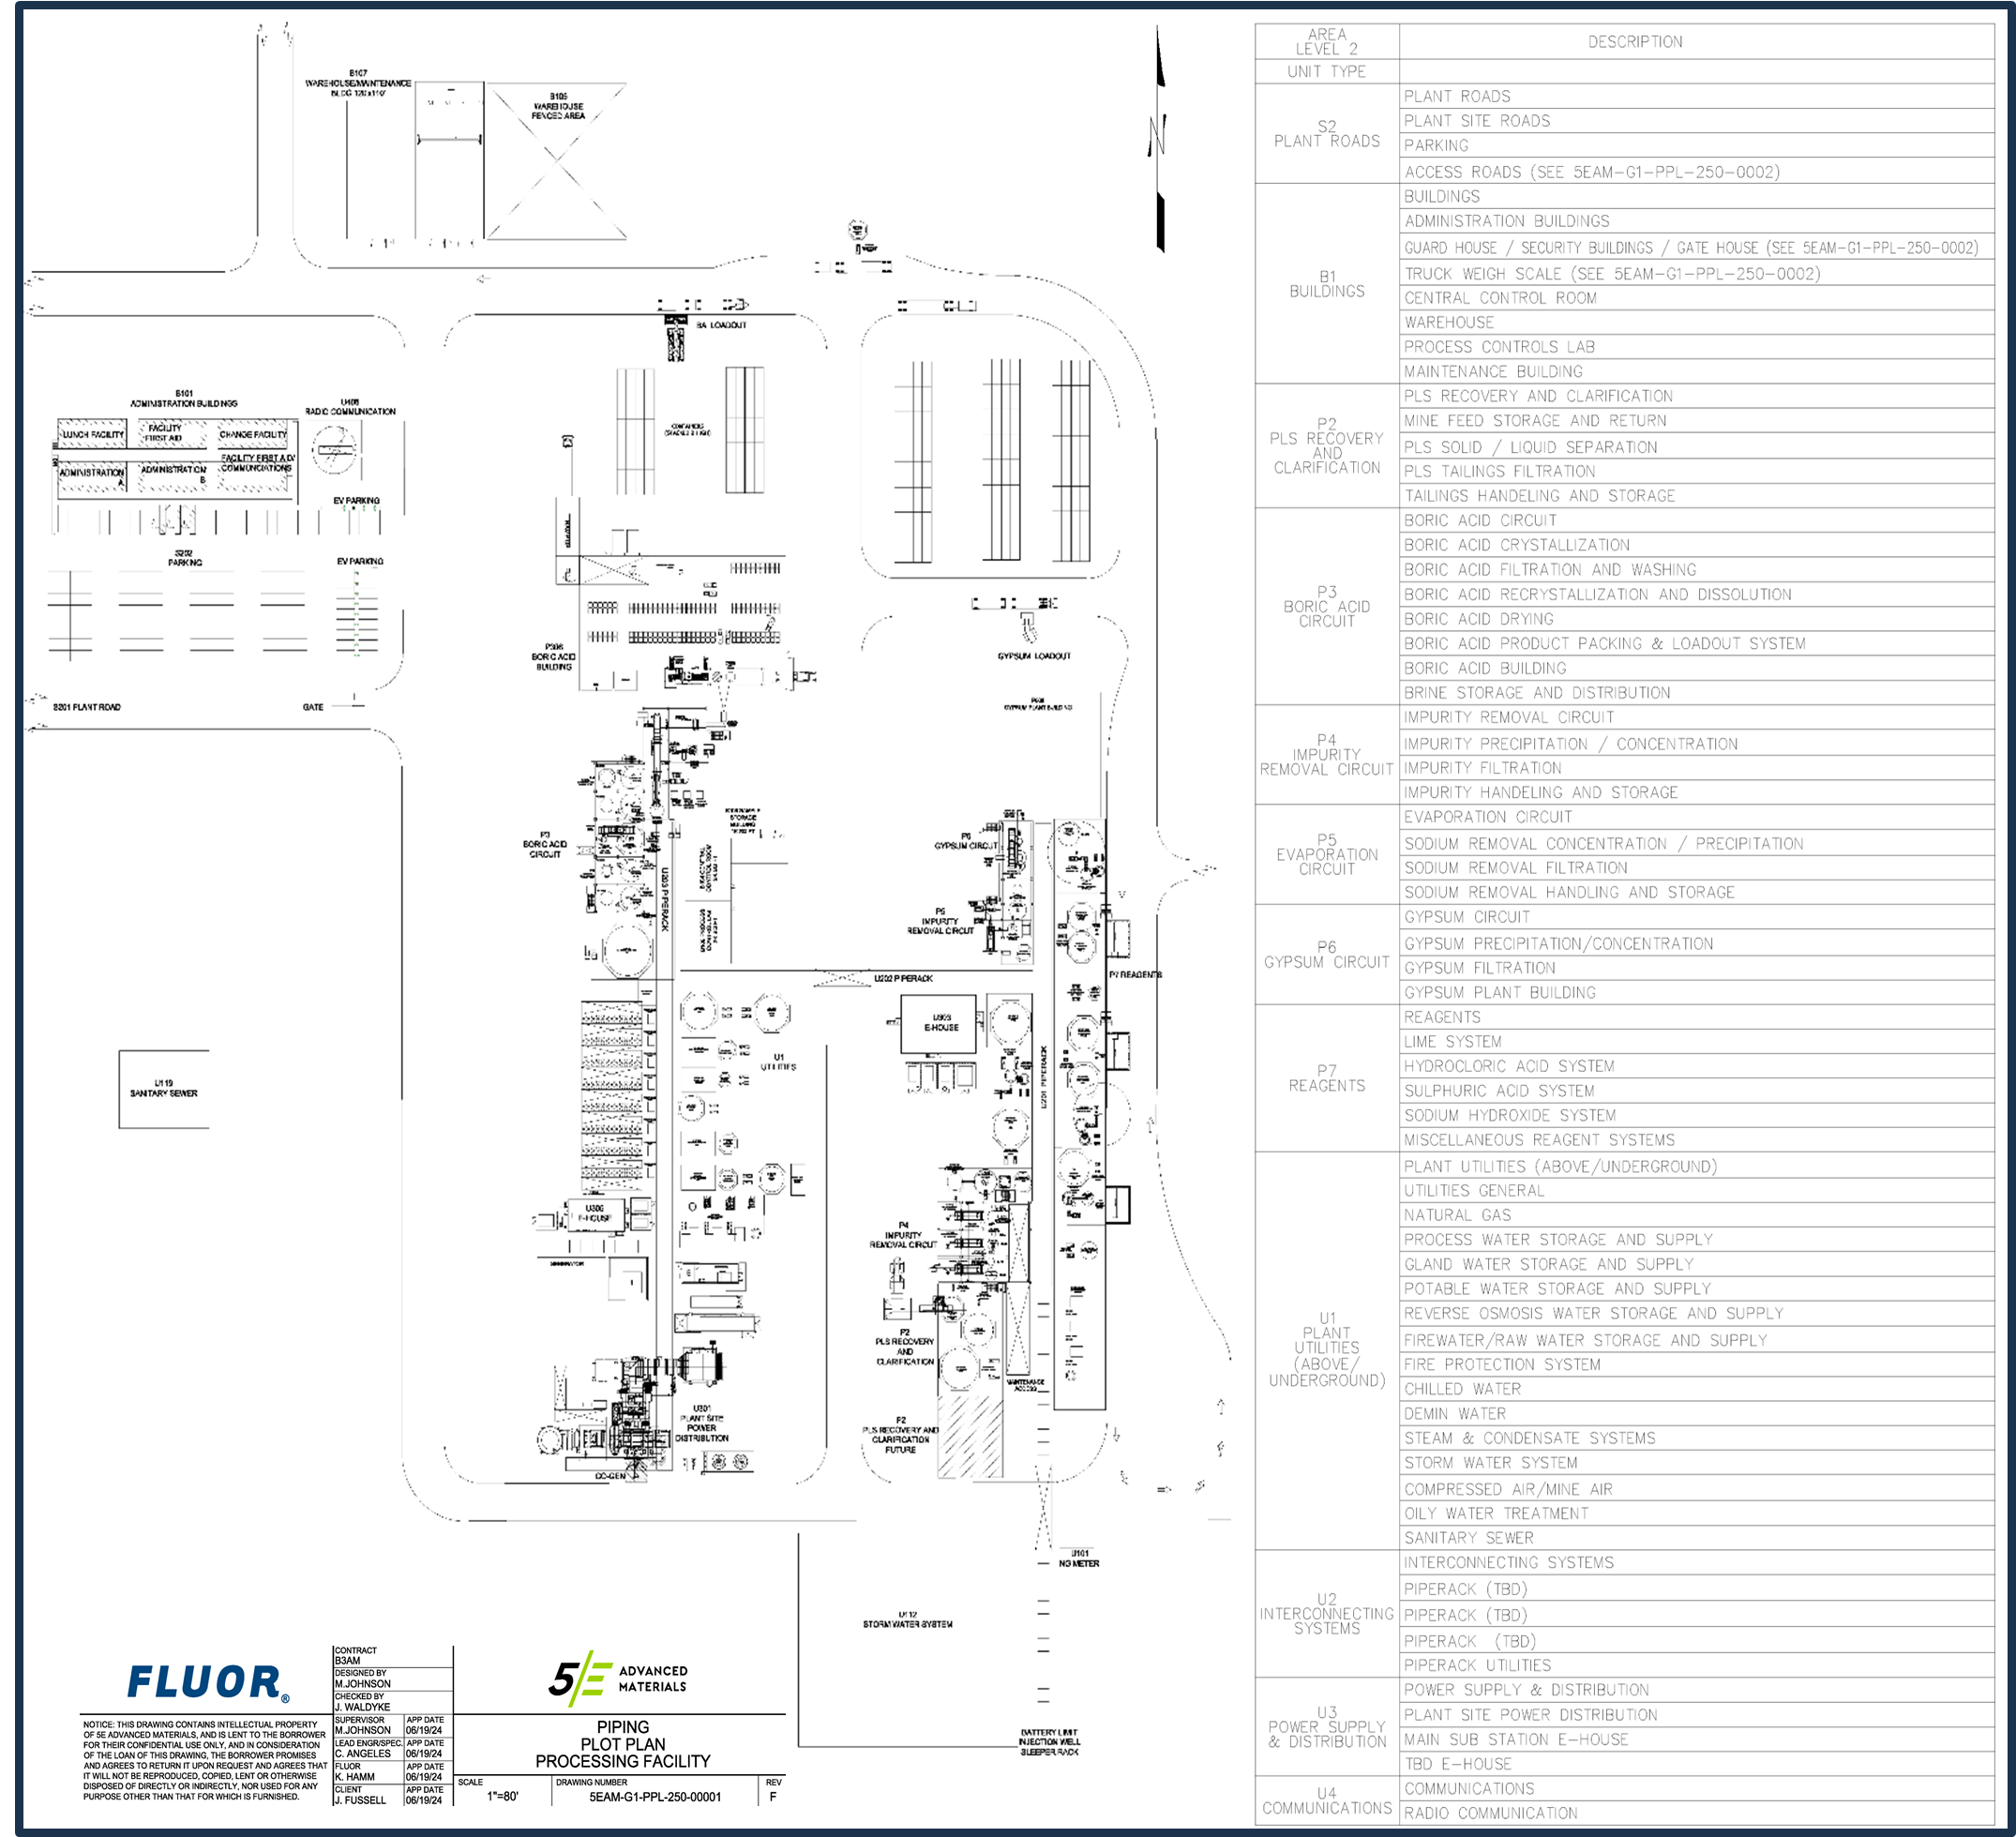
The Project is located halfway between Las Vegas, Nevada and Los Angeles, California and includes both private and federal land. The Project is located approximately 2 miles south of Interstate 40 and approximately 25 miles east of Barstow, California. The site is connected to approximately 1 megawatt of grid power and is approximately 2 miles from major natural gas transmission lines and the BNSF rail line. Figure 1 shows the project location.
Figure 1. Fort Cady Project Location
Mineral Resources
The Technical Report defines both Mineral Resources and Mineral Reserves for the Project. The Mineral Resources on lands under 5E’s mineral control include 23.5 million short tons of Measured ore containing 3.26 million short tons of in-situ boric acid, with an average grade of 7.91% B₂O₃. The Indicated category comprises 85.6 million short tons of ore containing 11.8 million short tons of in-situ boric acid, with an average grade of 7.89% B₂O₃. Mineral resources were estimated using a 2.0% B2O3 cut-off grade and Table 2 summarizes the mineral resources.
Table 2. Fort Cady Project Mineral Resources
*Mineral Resources
Short Tons (MST)
B2O3 (wt. %)
B2O3 (MST)
H3BO3 (MST)
Measured
23.50
7.91
1.84
3.26
Indicated
85.63
7.89
6.66
11.83
Total Measured + Indicated
109.13
7.89
8.50
15.09
Total Inferred
4.26
7.45
0.31
0.55
*Mineral Resources that are not Mineral Reserves do not have demonstrated economic viability. Under S-K 1300, inferred mineral resources are not considered economically recoverable within the current mine plan and are excluded from the production schedule and economic analysis. Inferred Mineral Resources include areas not currently under mineral tenure control. These are disclosed for transparency but excluded from the mine plan and economic model. The Company makes no assurance that mineral rights to these areas will be secured.
Notes to Mineral Resources:
The Mineral Resources in this estimate were independently prepared, including estimation and classification, by Steven Kerr, P.G., C.P.G, Escalante Geological Services, LLC, and are reported in accordance with the definition for Mineral Resources in S-K 1300.
The Mineral Resources were completed using a gridded seam model with Carlson Mining™ software.
The Mineral Resources are current as of March 10, 2025.
Mineral Resources are constrained assuming in-situ leaching and are reported at a cutoff grade of 2.0% B2O3, assume mineralized horizons exhibit lateral continuity that supports in-situ leaching mining methods and based on exploration data, there is reasonable continuity of colemanite mineralization throughout the deposit, respectively.
Only resources located on lands under current mineral control are reflected in the mine plan and economic analysis.
Mineral Reserves
A detailed mine production plan was developed to support the calculation of Mineral Reserves. The mine plan and wellfield optimization are based on third-party engineering work that incorporated 19 months of actual wellfield performance data from the SSF into the design.
Mineral Reserve assumptions, such as plant efficiency, leaching efficiency, and mining efficiency were taken into consideration to calculate the reserve estimate. The operating costs were derived from material and energy balances as well as a detailed labor build developed from first principles. The following steps and assumptions were used to calculate Mineral Reserves:
Measured and Indicated Mineral Resource of fee-based land and the power corridor were used as the base resource and Inferred Resources were excluded.
The mine plan includes a Phase 1 plan for which 5E has demonstrated mineral tenure.
Trade off analysis of actual vertical well performance relative to expected horizontal well performance can increase colemanite contact up to 20x with extended lateral wells and achieve permeable driven injection rates of +100 gallons per minute.
The surface chemical plant would deliver a 95.1% boric acid yield.
Leaching efficiency is 81.9% based on leach testing.
Solution mining efficiency is 95.0% based on the July 2025 horizontal well drill program.
Discounted cash flow incorporated capital and operating cost inputs.
Mineral Reserves are reported in-situ using a 2.0% B2O3 cut-off grade. Table 3 summarizes the Mineral Reserves for the Project.
Table 3. Fort Cady Project Mineral Reserves
Mineral Reserves
Average B2O3 Grade (wt. %)
Recoverable Mineralized Bed Volume (ft3)
B2O3 (MST)
H3BO3 (MST)
Proven
8.03
19,894,414
0.76
1.35
Probable
8.03
58,565,846
2.24
3.98
Total Reserves
8.03
78,460,260
3.00
5.33
Notes to Mineral Reserves:
The Mineral Reserves in this estimate were independently prepared, including estimation and classification, by Alan White, P.E., Miocene, Inc., and are reported in accordance with the definition for Mineral Reserves in S-K 1300.
The Mineral Reserve Estimate is based on a cut-off grade of 2.0% B₂O₃. Mining recovery, mining efficiency, and process recovery factors applied were 81.9%, 95.0% and 95.1%, respectively, based on pilot-scale testing and engineering assumptions outlined in the Pre-Feasibility Study.
Mineral Reserves are a subset of the Measured and Indicated Mineral Resources and do not include Inferred Mineral Resources nor any Mineral Resource for which 5E does not have mineral tenure.
The Mineral Reserves are current as of August 4, 2025.
Rounding, as required by the guidelines, may result in minor summation differences between tons, grade, and contained B2O3 or H3BO3 content.
Mining Method
The Project will be employing in-situ leaching as its mining method to recover borates from the mineralized horizons. The depth and grade of the deposit precludes conventional mining techniques such as open pit and underground mining. With ISL mining, there is no stripping of waste rock or underground development required for the Project. ISL activities include drilling and constructing of injection/recovery wells, installing pumping or airlifting extraction equipment on the wells, and piping to transport barren leach solutions to the wellfield and Pregnant Leach Solution (“PLS”) back to the chemical plant for processing.
Based on the results of operating the SSF injection, recovery wells and work completed by 5E, the Large-scale Boron Facility (“LSBF”) calls for the installation of 27 directional wells targeting the upper mineralized horizon (“UMH”), major mineralized horizon (“MMH”), and lower mineralized horizon (“LMH”) spaced at 200-ft horizontal offset and 120 – 180-ft vertical spacing. The operating strategy of the wells will focus on high-grade mineralization zone cavern development through continuous injection and cyclic push-pull mechanics.
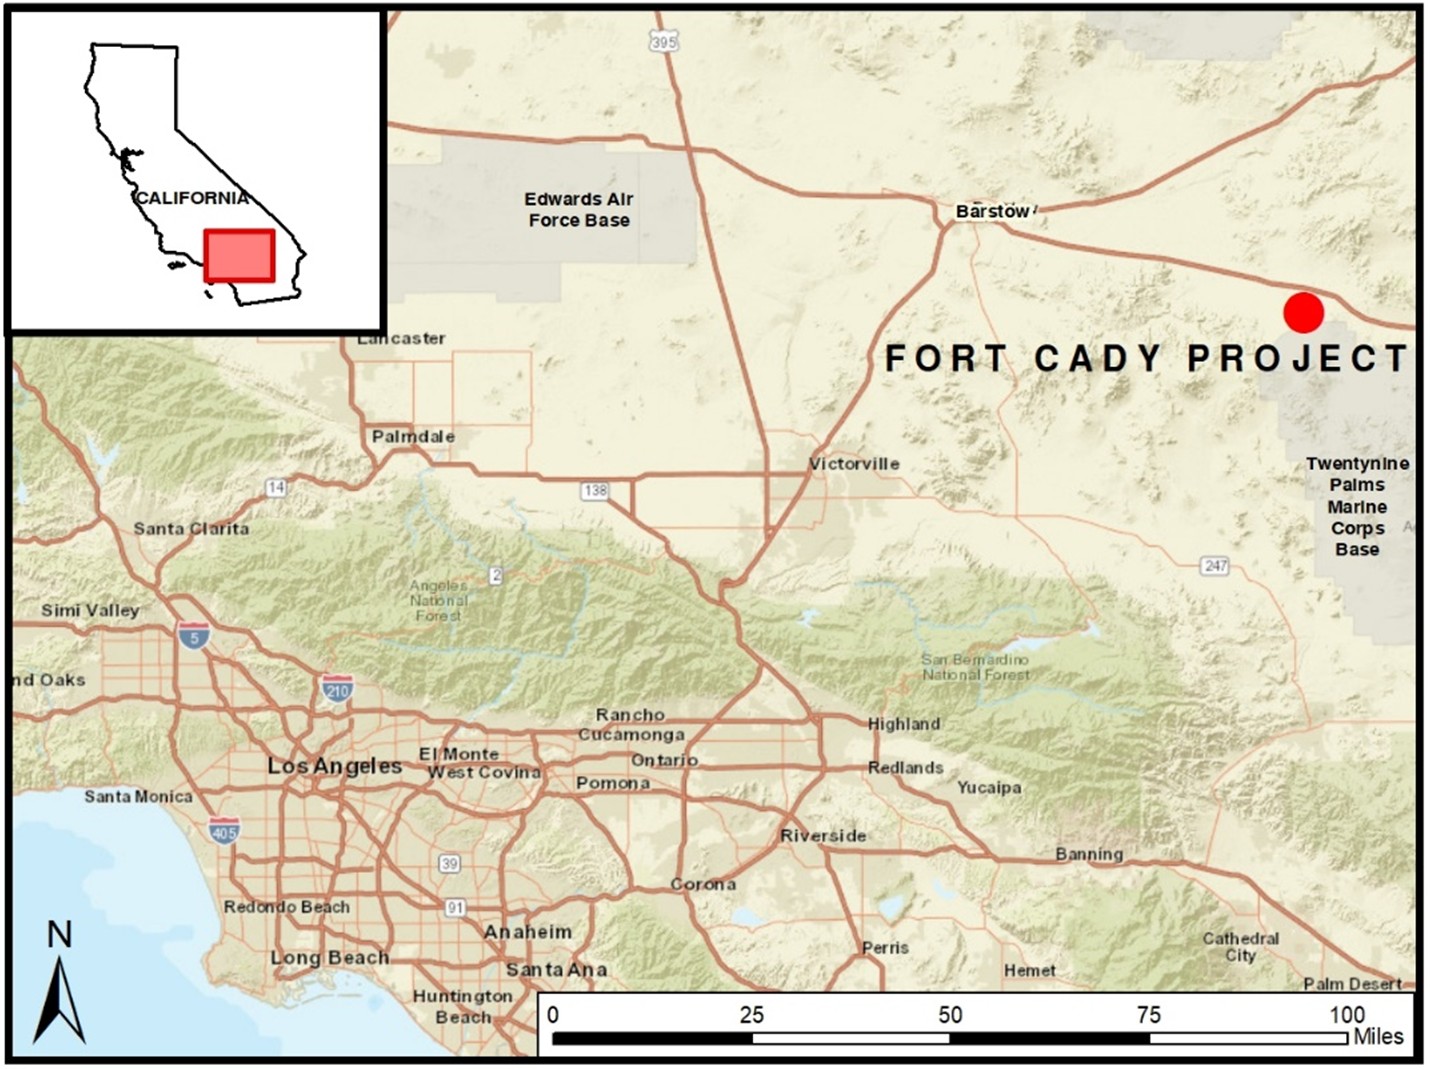
These wells are to operate as injection and recovery wells whereby injection and recovery of lixiviant through separate horizontal wellbores and full reservoir contact is accomplished by geo-steered laterals in a “fishbone” pattern and positively intercepting each well. The leach solution (lixiviant) is pumped into the well and, after a prescribed residence time, is retrieved from the same well, or offset wells as caverns develop, for processing. This method will be used until the dissolution of the colemanite in the deposit progresses to where complete reservoir flow is established between regional groups of wells. Figure 2 details the horizontal well schematic across the deposit.
Figure 2. Fort Cady Wellfield
Processing and Recovery Methods
The processing facility at the LSBF is engineered to support high-efficiency, high-throughput extraction and refinement of boric acid and associated byproducts from the PLS. 5E successfully executed an extensive program of mineral processing and metallurgical testing. Based on these results, the company has selected a proven, crystallization-based process for boric acid extraction. This method has been validated through both laboratory-scale experiments and the operational success of the SSF. The following is a description of the process steps:
Solution Mining and Injection: Target minerals are dissolved in-situ using solution mining techniques utilizing heat and steam. The resulting PLS is transported via pipeline infrastructure to the surface processing facilities.
PLS Recovery and Clarification: The PLS undergoes pH adjustment through lime addition, which reduces acidity and enables the use of more cost-effective materials of construction. A multi-stage solid-liquid separation process, including filtration, removes precipitated solids, yielding a clarified solution ready for downstream processing.
Figure 3 Planned Site Layout
Boric Acid Circuit: This core section of the process is dedicated to the concentration, extraction, and purification of boric acid. A two-stage vacuum chilled crystallization system initiates the precipitation of boric acid, followed by filtration, washing, and redissolution. A second two-stage recrystallization step ensures high-purity product formation. Final dewatering is achieved via centrifugation, and the wet crystals are dried in a rotary dryer, cooled, and packaged. A portion of the centrate is directed to the Impurity Removal Circuit and the remainder is sent to the Gypsum circuit.
Impurity Removal Circuit and Evaporation: In the Impurity Removal stage, magnesium hydroxide [Mg(OH)₂] and other impurities are removed from the process stream through a reaction with hydrated lime. This reaction causes the impurities to precipitate, allowing them to be separated via filtration. The filtrate slurry then enters the evaporation circuit, where mechanical evaporators and evaporation ponds precipitate sodium chloride for removal. The concentrated brine, now enriched with calcium chloride (CaCl2), is either directed to truck loading for sale as a byproduct or sent to the Gypsum Circuit for further processing.
Gypsum Circuit: The Calcium Chloride rich brine reacts with sulfuric acid to precipitate gypsum, which is then filtered and refined to be sold as a byproduct. This circuit also facilitates the regeneration of hydrochloric acid, which is recycled back to the wellfield for reuse in the mining process.
Infrastructure
The Project is located near Interstate 40 along with nearby access to rail and a natural gas transmission line. Currently, the Project receives approximately 1 megawatt of shore power.
Infrastructure required for the Project is expected to consist of:
Natural gas – the Project will require a natural gas pipeline that will need to be connected into a nearby transmission pipeline to serve the processing plant. Discussions are ongoing with a proposal received from the owner of the pipeline and the cost of piping from the Mojave Pipeline to a cogeneration facility (COGEN) included in the capital estimate.
Electrical power upgrade – an economic trade-off study is currently being conducted to evaluate co-generation versus an upgraded and dedicated powerline to the Project. The economic analysis in the Technical Report assumes the Project utility is COGEN.
Rail – a connection to a rail spur adjacent to the Project is included in the federal permit. Phase 1 logistics contemplate trucking finished product to the customers in the western United States and the Los Angeles ports. Byproducts are expected to be sold in the local California market. Tie-in to rail is expected to be considered for expansion phases of the Project.
Roads – Plant access roads will require upgrades, and some roads may require paving. New access roads are also being considered.
Water – 5E currently has adequate water resources for Phase 1 of the project with two existing water wells with millsite claims for each well.
Material storage – storage for materials products and consumables will need to be built with storage for boric acid and gypsum included in the capital estimate. A calcium chloride load-out station is also included in the capital estimate and is expected to be stored in tanker trucks ready for distribution.
Environmental
In 1990, a Plan of Operations was submitted to the United States Bureau of Land Management (“BLM”) and a Mining Conditional Use Permit and Reclamation Plan was submitted to San Bernardino County, which triggered environmental review under the National Environmental Policy Act (“NEPA”) and the California Environmental Quality Act (“CEQA”). The BLM and San Bernardino County prepared a joint Environmental Impact Statement (“EIS”) and Environmental Impact Report (“EIR”) to satisfy their environmental review requirements under NEPA and CEQA. In 1994, the EIS and EIR process resulted in the issuance of a Record of Decision from the BLM that approved the Plan of Operations and approval of the Mining Condition Use Permit and Reclamation Plan from San Bernardino County. The Project is permitted to produce 90,000 short tons per year of borates, defined as boron oxide or boron oxide equivalent, thus permitting up to approximately 160,000 short tons of boric acid.
In 2020, a Class 3 Underground Injection Control (“UIC”) permit was issued by the United States Environmental Protection Agency (“EPA”). The EPA retains primacy for Class 3 solution mining UIC permits. In November 2023, the EPA approved the commencement of mining operations under this permit. These regulatory approvals form the foundation for Phase 1 development, which aligns with the previously authorized project scope.
Capital Costs
The Technical Report Summary for the Project has been successfully completed by Engineering, Procurement, and Construction Management company Fluor Corporation, Petroleum Engineering and Operating Services company Miocene, Inc., along with collaboration with Ad Infinitum, an engineering firm specializing in chemical process design. An AACE Class 4 estimate capital cost estimate (± 25%) has been prepared. The AACE Class 4 capital estimate covers the period from Front End Engineering Design engineering to first production and is reported in real dollars.
Capital cost expectations for a 130,000 short ton per annum boric acid plant (inclusive of co-product processing and COGEN power) were determined to be $367M for the first stage plus a contingency of $55M and owner’s cost estimate of $13M for a total capital estimate of $435M. Table 4 outlines the capital cost estimate, including initial development costs and a conservative provision for sustaining capital, based on solution mining-specific assumptions, including periodic wellfield expansion, re-drilling, and maintenance costs over the life of mine.
Table 4. Capital Cost Estimate
Scope
Capital Cost (USD Millions)
Process Facility
$280.7
COGEN
$50.2
Wellfield
$30.8
Evaporation Ponds
$5.6
Sub-total
$367.3
Contingency
$55.1
Owner’s Cost
$12.5
Total Capital
$434.9
Operating Costs
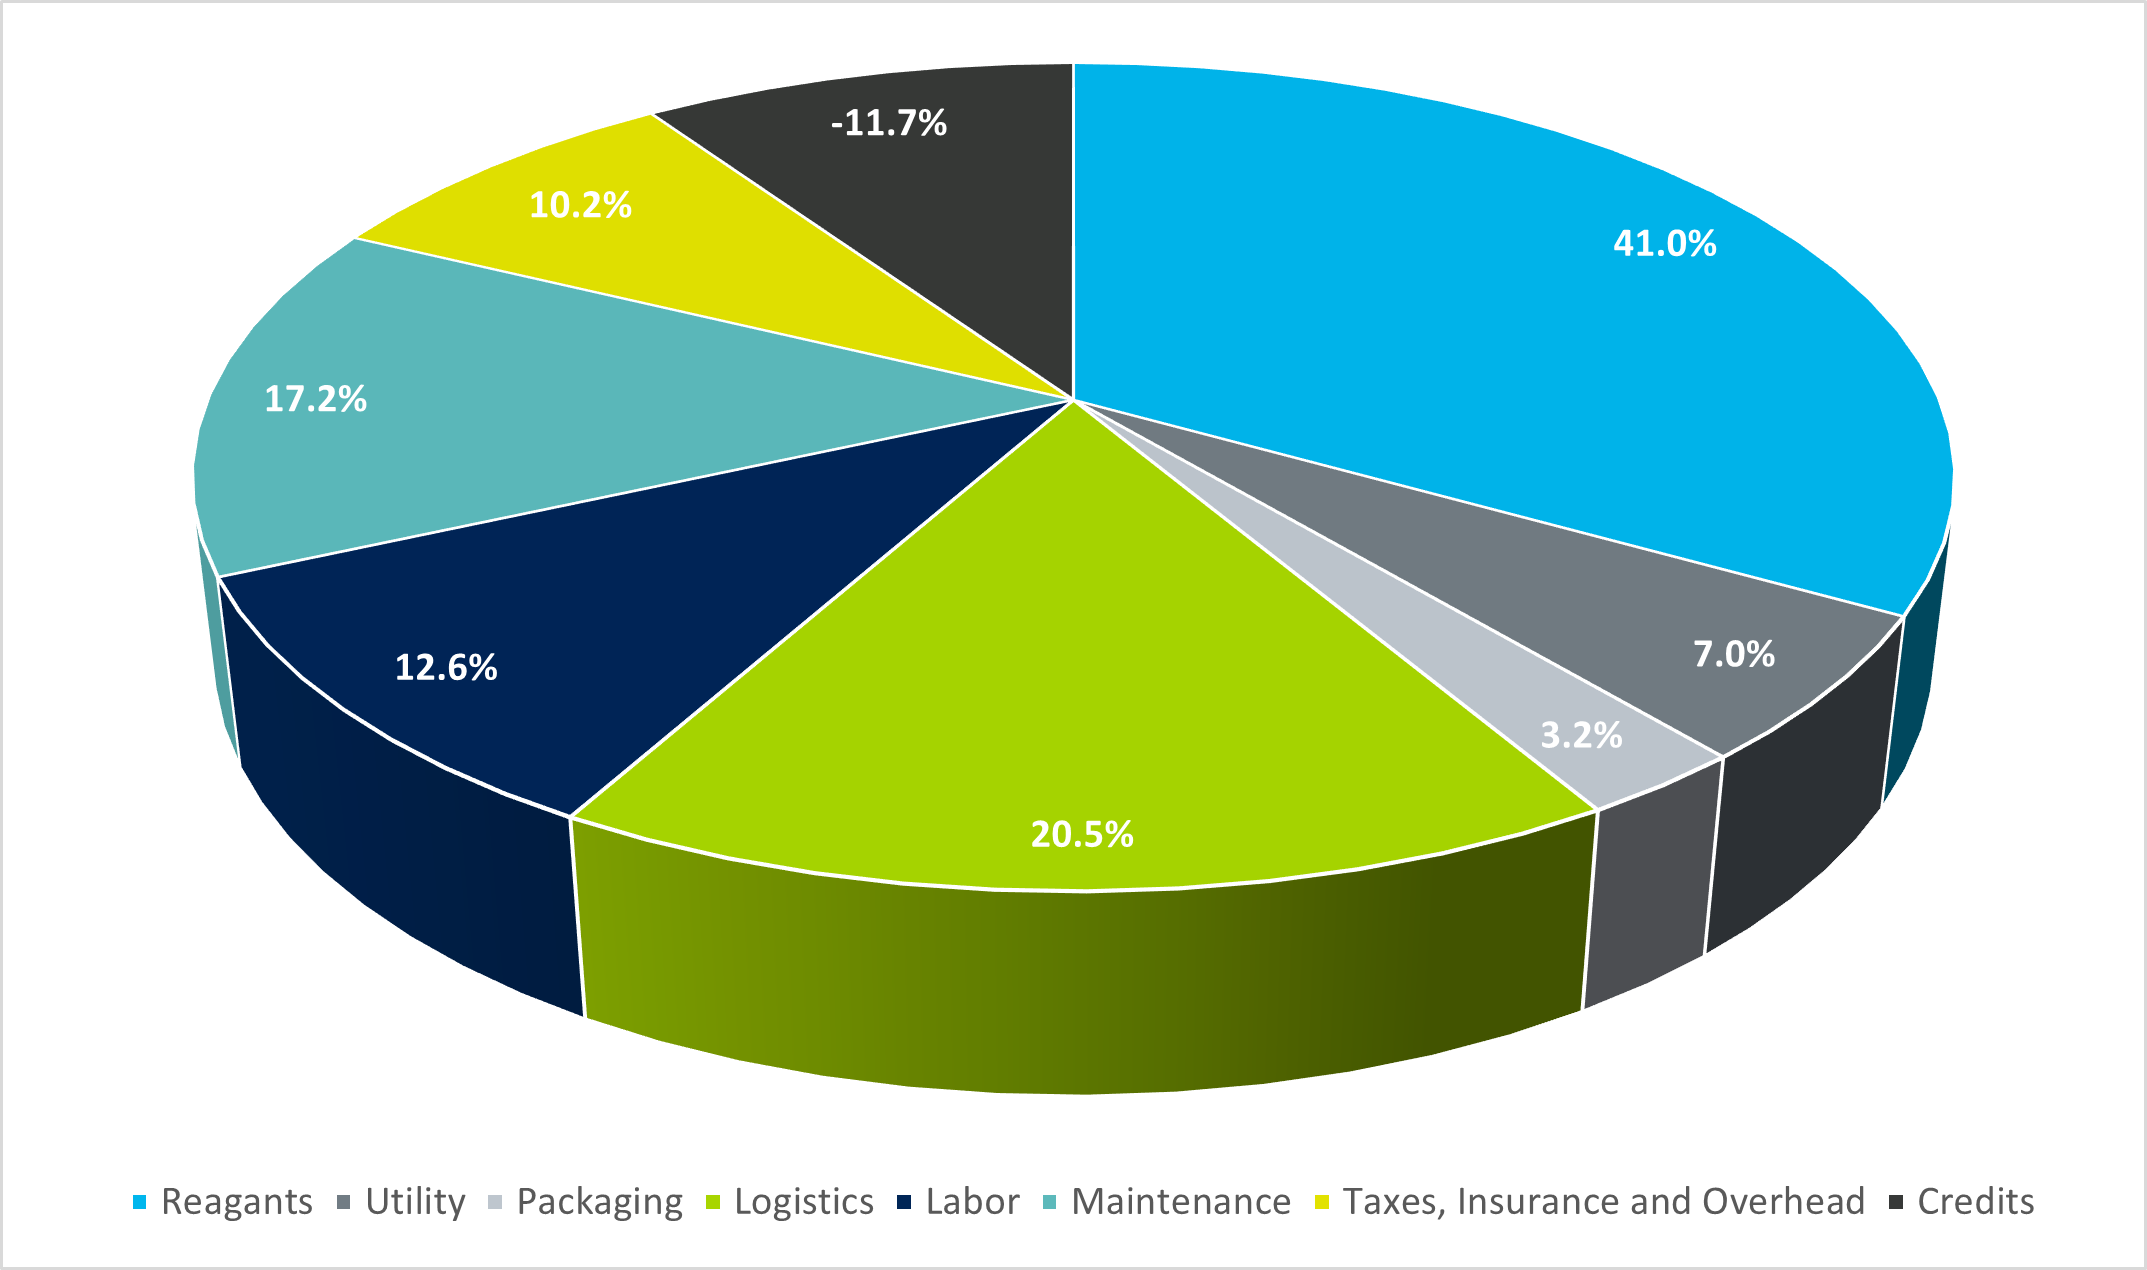
Operating costs for the project are segregated into Variable, Fixed, and Other operating costs and are based on detailed material and energy balances provided by Fluor Corporation and a principles first labor build-up. Variable operating costs include packaging, logistics, and raw materials such as natural gas, hydrochloric acid, sulfuric acid, and lime. Fixed operating costs include administrative labor, operating labor, general and administrative overhead, repair labor, repair materials, as well as taxes and insurance. Other operating costs include disposal costs of metals impurities offset with byproduct credits from gypsum and calcium chloride. Table 5 summarizes the operating cost by production phase.
Table 5. Operating Cost
Operating Costs (Full-Run Rate)
Variable Costs
$/t H3BO3
405.7
Fixed Costs
$/t H3BO3
222.1
Credits
$/t H3BO3
(73.0)
Total Costs (inclusive of logistics)
$/t H3BO3 (net)
554.8
Figure 4. Operating Cost Breakdown
Economic Analysis
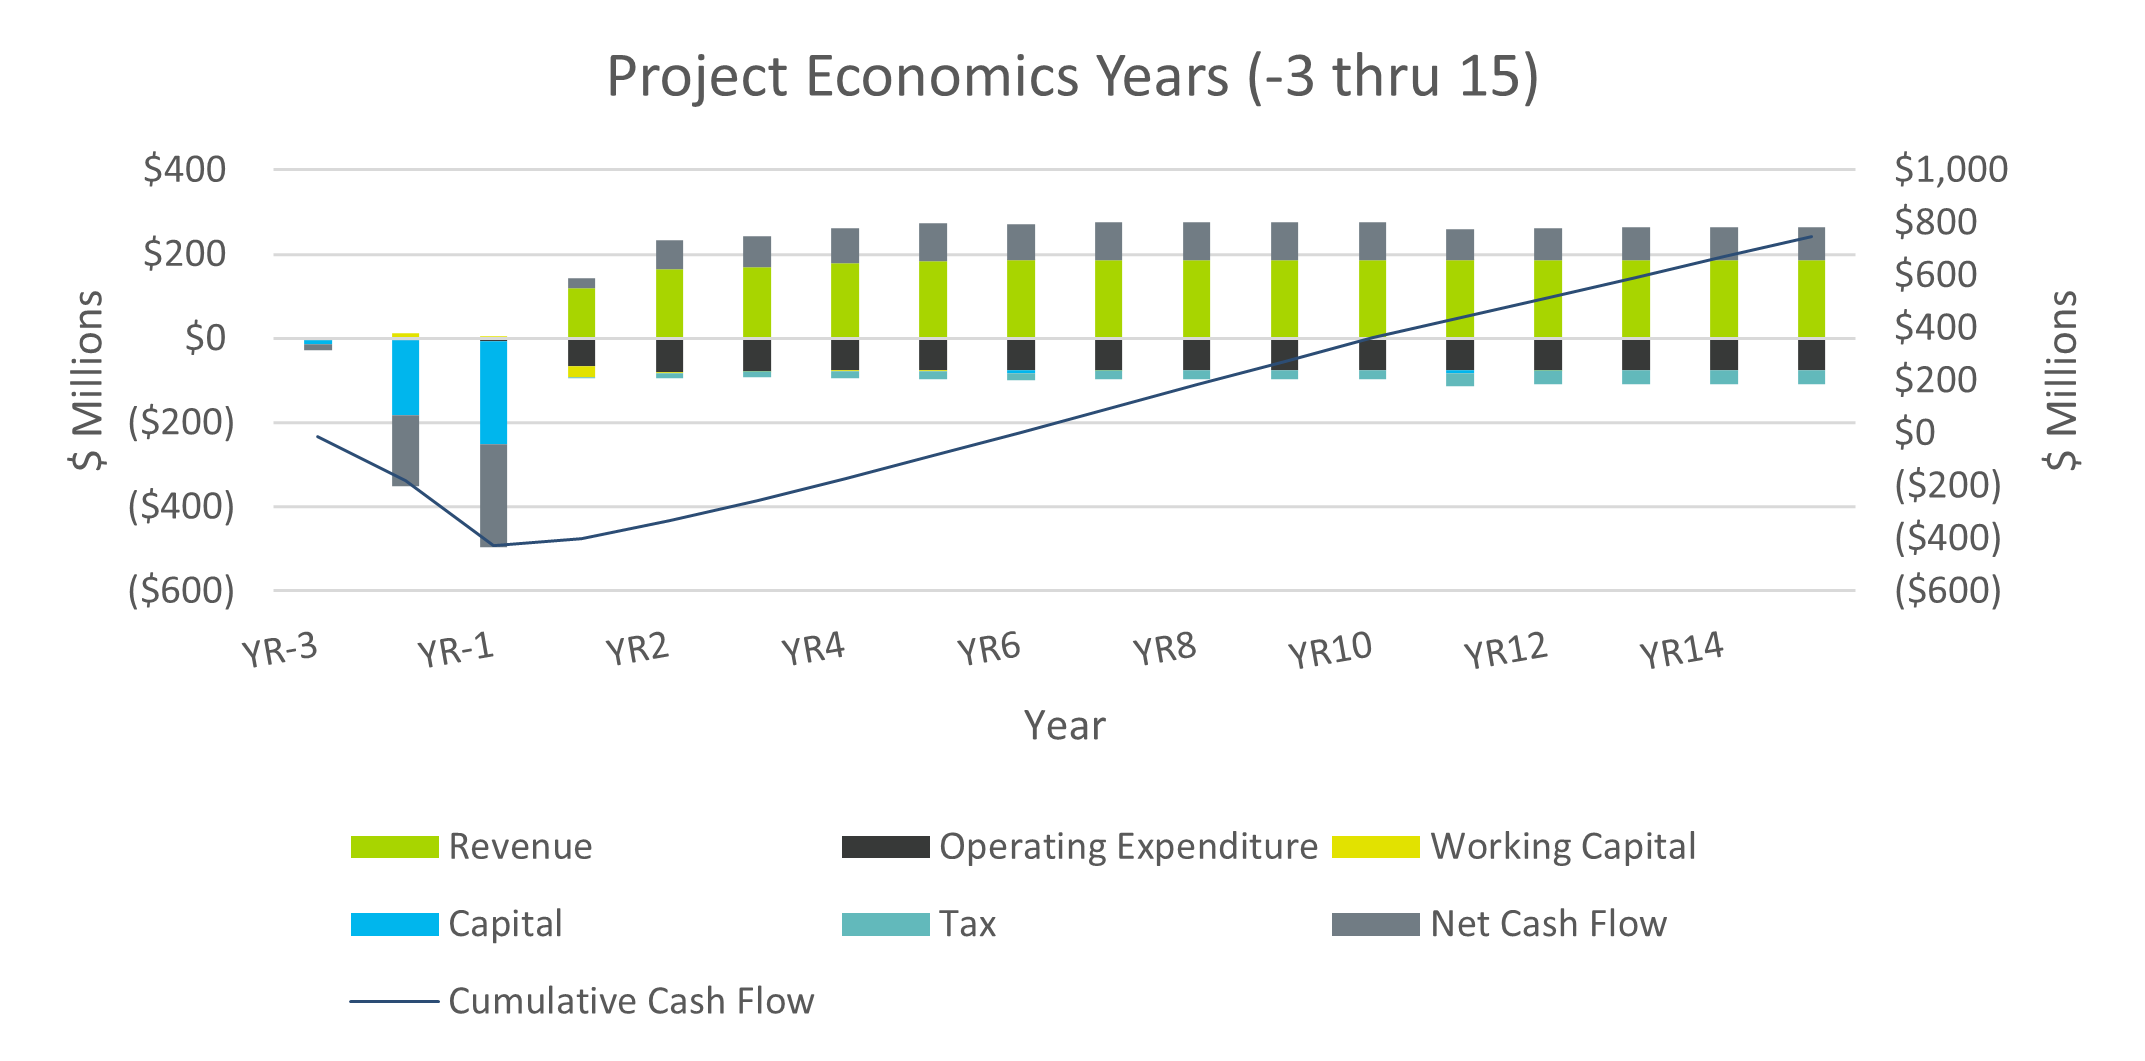
The Project economics were evaluated using a discounted cashflow analysis based on annual cashflows for the life of the project. The financial model was prepared on an annual basis from the mineral reserve effective date to the exhaustion of mineral reserves for the current mining plan. Mine life can be extended and the Project has additional resources that can be converted to additional mineral reserves with expansion of the wellfield or mine plan in the future. The financial model results are presented in real U.S. dollars.
As with the capital and operating forecasts, the economic analysis is inherently a forward-looking exercise. These estimates rely upon a range of assumptions and forecasts that are subject to change depending upon macroeconomic conditions, operating strategy and new data collected through operation of the SSF. Table 6 summarizes the economic results and Figure 5 highlights project cashflows during the first 15 years.
Table 6. Economic Analysis Summary
Description
Units
Total/Amount
Average Price LOM – H3BO3
$ / short ton
1,355
Netback Price – Gypsum
$ / short ton
21
Netback Price – CaCl2
$ / short ton
120
Pre-Tax: Free Cashflow
$M USD
3,749
Pre-Tax: NPV7
$M USD
725
Pre-Tax: IRR
%
19.2
After-Tax: Free Cashflow
$M USD
2,625
After-Tax: NPV7
$M USD
469
After-Tax: IRR
%
15.9
After-Tax: Payback Period
years
5.9
Figure 5. Cashflow Profile by Year
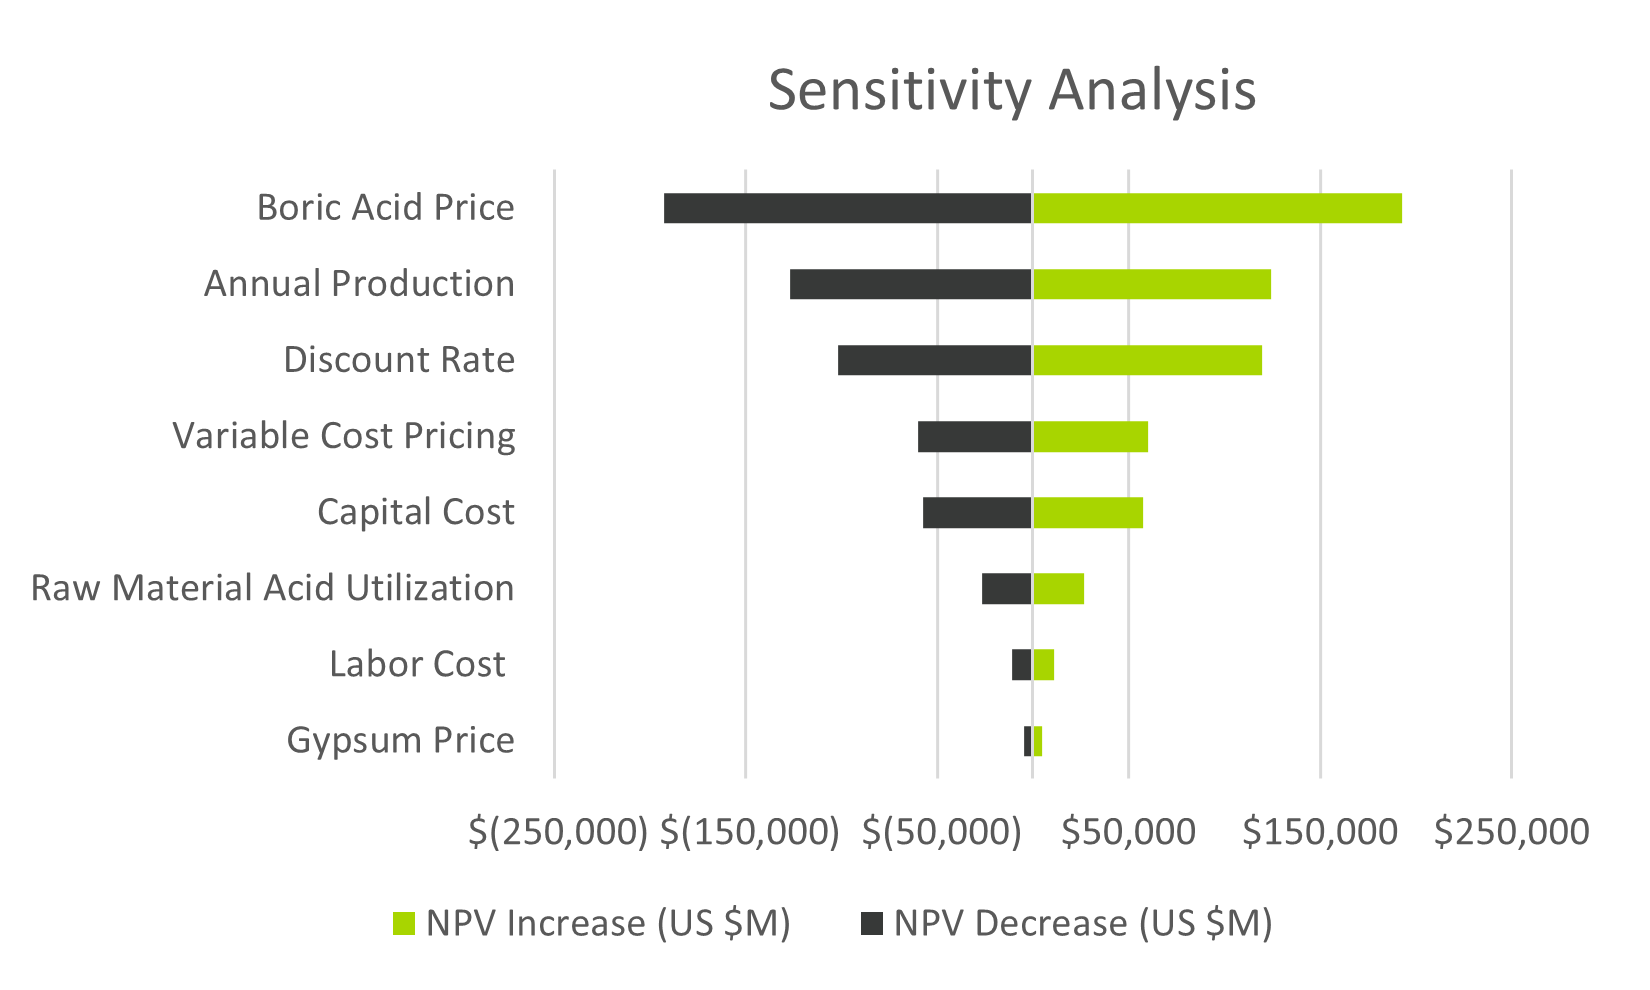
Financial Model Sensitivity
Sensitivity analysis for the financial model was performed based on changes to boric acid price, annual production, discount rate, variable cost pricing, gypsum price, labor cost per person, and raw material acid utilization. Using a ±10% change for each variable, NPV7 is plotted in real dollars for comparison and arranged in order of total variability.
Figure 6. Economic Sensitivity
Qualified Persons
The Technical Report, entitled “Preliminary Feasibility Report & Technical Report Summary, 5E Advanced Materials Fort Cady Project,” dated August 7, 2025, was prepared in accordance with the Securities and Exchange Commission S-K regulations, Title 17, Part 229, Items 601 and 1300 through 1305. The Technical Report was prepared by the following firms and persons: Miocene, Inc., Fluor Corporation, Geomega, Inc., Escalante Geological Services, LLC and Mr. Paul Weibel. With the exception of Mr. Weibel, who serves as the Company’s Chief Executive Officer, none of the qualified persons is affiliated with the Company or any other entity that has an ownership, royalty, or other interest in the property.
The Technical Report will be available on the U.S. Securities and Exchange’s EDGAR website as an Exhibit 96.1 to the Current Report on Form 8-K filed by the Company on August 7, 2025, in connection with this news release. The Technical Report includes relevant information regarding the assumptions, parameters, and methods used for the Mineral Resource and Mineral Reserve estimates for the Fort Cady Project, as well as information regarding data verification, exploration procedures, and other matters relevant to the scientific and technical disclosure contained in this news release.
Other disclosures of a scientific or technical nature included in this news release regarding the Fort Cady Project have been reviewed, verified, and approved by Mr. Paul Weibel, Chief Executive Officer of 5E Advanced Materials, Inc. who is a Qualified Person as defined by Regulation S-K, Subpart 1300 promulgated by the U.S. Securities and Exchange Commission. Mr. Weibel is responsible for reviewing information related to market strategy, product pricing, and economic assumptions.’
The complete Technical Report titled “Preliminary Feasibility Report & Technical Report Summary, 5E Advanced Materials Fort Cady Project” is available on EDGAR as Exhibit 96.1 to the Company’s Current Report on Form 8-K filed on August 7, 2025. It is also available on the Company’s website – HERE.
About 5E Advanced Materials, Inc.
5E Advanced Materials, Inc. (Nasdaq: FEAM) (ASX:5EA) is focused on becoming a vertically integrated global leader and supplier of boron specialty and advanced materials, complemented by lithium co-product production. The Company’s mission is to become a supplier of these critical materials to industries addressing global decarbonization, food and domestic security. Boron and lithium products will target applications in the fields of electric transportation, clean energy infrastructure, such as solar and wind power, fertilizers, and domestic security. The business strategy and objectives are to develop capabilities ranging from upstream extraction and product sales of boric acid, lithium carbonate and potentially other co-products, to downstream boron advanced material processing and development. The business is based on our large domestic boron and lithium resource, which is located in Southern California and designated as Critical Infrastructure by the Department of Homeland Security’s Cybersecurity and Infrastructure Security Agency.
Forward Looking Statements
This press release includes “forward-looking statements” within the meaning of the Private Securities Litigation Reform Act of 1995, as amended. All statements other than statements of historical fact included in this press release should be considered forward looking statements, including without limitation statements regarding the Project’s capital and operating costs; cash costs to produce boron and its related byproducts, as well as estimated contingencies; projected future pricing for boric acid and its related byproducts; the forecasted net present value; projected production volumes and revenues; anticipated cash flows; anticipated cut-off grade and recovery rates; the proposed design of the commercial scale facility; the timing of large-scale commercial production; construction timelines; ability to maintain and modify permits; infrastructure needs; environmental impacts; potential to successfully finance the company and the proposed commercial scale facility; anticipated market value and demand for boric acid, calcium chloride and gypsum; potential technology solutions; anticipated use of land and water; potential for expansion of mineral resources; mineral resource and reserve estimates and assumptions; the potential for future phases of the Project; availability of energy to operate the facility; the economic potential of the Project; and our ability to produce boron and its related byproducts. When used in this press release, the words “believe,” “project,” “expect,” “anticipate,” “estimate,” “intend,” “budget,” “target,” “aim,” “strategy,” “plan,” “guidance,” “outlook,” “intent,” “may,” “should,” “could,” “will,” “would,” “will be,” “will continue,” “will likely result,” and similar expressions are intended to identify forward-looking statements, although not all forward-looking statements contain such identifying words. These forward-looking statements are based on the Company’s current expectations and assumptions about future events and are based on currently available information as to the outcome and timing of future events. We caution you that these forward-looking statements are subject to all of the risks and uncertainties, most of which are difficult to predict and many of which are beyond our control, incident to the extraction of the critical materials we intend to produce and advanced materials production and development. These risks include, but are not limited to: our ultimate ability to satisfy all customer qualification criteria and achieve commercial offtake agreements, our limited operating history in the borates and lithium industries and no revenue from our proposed extraction operations at our properties; our need for substantial additional financing to execute our business plan and our ability to access capital and the financial markets; our status as an exploration stage company dependent on a single project with no known Regulation S-K 1300 mineral reserves and the inherent uncertainty in estimates of mineral resources; our lack of history in mineral production and the significant risks associated with achieving our business strategies, including our downstream processing ambitions; our incurrence of significant net operating losses to date and plans to incur continued losses for the foreseeable future; risks and uncertainties relating to the development of the Fort Cady project, including our ability to timely and successfully complete our proposed Commercial Scale Boron Facility; our ability to obtain, maintain and renew required governmental permits for our development activities, including satisfying all mandated conditions to any such permits; the implementation of and expected benefits from certain reduced spending measures; the impact of changes in U.S. trade policies and the imposition of tariffs; and other risks and uncertainties set forth in our filings with the U.S. Securities and Exchange Commission from time to time. Should one or more of these risks or uncertainties occur, or should underlying assumptions prove incorrect, our actual results and plans could differ materially from those expressed in any forward-looking statements. No representation or warranty (express or implied) is made as to, and no reliance should be placed on any information, including projections, estimates, targets, and opinions contained herein, and no liability whatsoever is accepted as to any errors, omissions, or misstatements contained herein. You are cautioned not to place undue reliance on any forward-looking statements, which speak only as to the date of this press release.
For additional information regarding these various factors, you should carefully review the risk factors, uncertainties and other disclosures in the Company’s Form 10-K filed on September 9, 2024, as updated by the Company’s Form 10-Q filed on May 15, 2025, and subsequent filings with the U.S. Securities and Exchange Commission throughout the year, as well as in its filings under the Australian Securities Exchange. Any forward-looking statements are given only as of the date hereof. Except as required by law, 5E expressly disclaims any obligation to update or revise any such forward-looking statements. Additionally, 5E undertakes no obligation to comment on third party analyses or statements regarding 5E’s actual or expected financial or operating results or its securities.
The LHH Interview Center builds interview and networking confidence while supporting self-guided learning and AI skill development for today’s evolving job market.
NEW YORK, NY / ACCESS Newswire / August 7, 2025 / LHH, the integrated professional talent solutions provider and global business unit of the Adecco Group, today announces its global roll out of the new LHH Interview Center that is a part of the LHH Career Studio.
Designed for people navigating career transitions worldwide, the LHH Career Studio is a digital platform that leverages 50 years of industry expertise, behavioral science and advanced research to deliver a dynamic suite of career solutions. With AI-driven features, real-time job market data and professional coaching, the LHH Career Studio supports over 500,000 candidates and thousands of organizations annually, across over 60 countries worldwide.
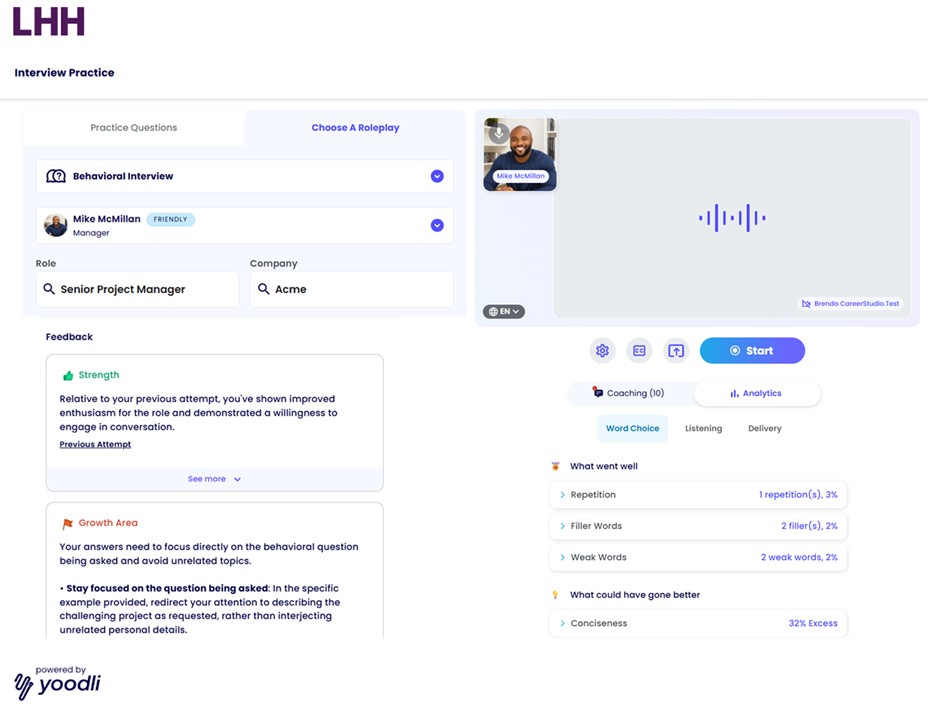
The LHH Interview Center helps candidates master interview skills through realistic simulations, smart responses and live feedback. Its private, customizable experience builds soft skills on demand, enabling job seekers navigating career changes to feel prepared and in control of their next step.
In the LHH Interview Center, an AI interviewer engages users in practical roleplay by asking contextual questions, responding dynamically and providing actionable commentary on delivery, content and communication style. This platform supports multiple interview formats where users can customize their practice to tailored questions based on job descriptions, to ensure preparation is both relevant and effective.
“At LHH, we are committed to providing the most innovative candidate experience in the market, with human need at the top of mind,” says John Morgan, President of LHH’s Career Transition & Mobility, Leadership Development & Coaching and HR & Talent Advisory. “Technology can scale career transition support, but empathy is at the core of any transition work. In today’s shifting job market, we are evolving our tools to meet the needs of candidates facing unpredictable career transitions. The LHH Career Studio is intentionally designed so candidates can be successful, and the LHH Interview Center equips job seekers to build self-awareness and trust in their skills, helping them find better-fit opportunities faster.”
Launched in the United States earlier this year and now expanding globally, the tool has seen strong adoption and enthusiasm. Many users return for multiple sessions, with some completing more than 300 practice sessions.
Recognizing that even the most advanced algorithms cannot replace genuine human support, LHH Career Transition coaches and talent leaders help candidates interpret the data and skills identified by the tool. The AI-garnered insights allow coaches to focus more deeply on relationship building, guiding candidates through the emotional challenges of career transition.
“The combination of Yoodli’s cutting-edge technology with LHH’s career transition expertise has resulted in a thoughtful, pioneering and content-rich solution,” says Varun Puri, CEO and Co-Founder of Yoodli. “Candidates describe it as an immersive simulation experience, especially valuable for those who have not interviewed in years, are changing career paths or have limited opportunities and cannot afford to fail. It is also a confidence booster for those anxious about what might come up in a real interview.”
The LHH Interview Center is now available on Career Studio in the U.S. and is being rolled out for all LHH Career Transition candidates globally in September this year.
For organizations looking to empower transitioning talent, learn more about how to inspire career transformation with the LHH Career Studio.
###
About LHH LHH empowers professionals and organizations to achieve bold ambitions and secure lasting impact through unique advisory services and professional talent solutions.
LHH’s full suite of offerings connects solutions that are traditionally siloed, making LHH a single talent partner for organizations. In a rapidly evolving landscape with complex challenges, we create value across the entire professional talent journey. From hiring great people, developing skills and nurturing leaders, to advancing individuals to the next stage of their careers, LHH makes talent a competitive edge.
We believe the future of work lies at the intersection of exceptional human care and innovation. Powered by science, technology, and proprietary data analytics, LHH’s approach is crafted to align with business strategies and cultures, delivering powerful, sustainable, and measurable impact.
LHH has a team of over 12,000 professionals, across 60+ countries and more than 50 years of experience. As part of the Adecco Group, we bring together global excellence, local knowledge and centralized coordination for thousands of companies and millions of people worldwide.
Recruitment. Development. Career Transition. LHH. A beautiful working world.
About Yoodli Yoodli is the market leader in AI-powered communication coaching. Trusted by Fortune 500 companies, business schools, and coaching organizations, Yoodli helps individuals improve sales pitches, public speaking, interviewing, and persuasive communication through interactive roleplay and data-driven feedback. Its AI technology enables scalable and personalized practice for every professional.
Media Contacts LHH Global External Communications PR@lhh.com
Main Graphics, a leading commercial print provider based in Irvine, California, is proud to announce the significant expansion of its large format printing services. The company has increased its production capacity and upgraded its equipment to better serve a growing client base across Orange County and surrounding areas. This development positions Main Graphics as one of the region’s go-to providers for high-quality large format printing, including banners, posters, event signage, point-of-purchase displays, and more.
Known for its customer-first approach and fast turnaround times, Main Graphics has been a trusted partner for local businesses for over two decades. As demand for large format printing continues to rise across industries such as retail, real estate, construction, education, and event management, the company has made strategic investments to ensure it can deliver top-tier visual materials at scale—without compromising the quality or consistency that clients have come to expect.
The expansion includes the addition of high-performance large format printing equipment that supports a wide range of media types, finishes, and display formats. This not only enables faster job completion but also opens the door to a broader variety of custom print solutions. Businesses throughout Irvine, Anaheim, Santa Ana, Huntington Beach, Costa Mesa, Tustin, and beyond will now benefit from an even more robust offering tailored to their signage and marketing needs.
“Today’s businesses are looking for ways to stand out in crowded, competitive environments,” said a company representative. “Whether it’s a retail store needing vibrant window graphics, a real estate agent requiring durable outdoor signage, or a corporate team preparing for a major event, high-quality large format printing plays a vital role in visibility and branding. We’ve expanded our capabilities to meet that demand head-on and give local businesses a clear edge in the marketplace.”
As part of this service expansion, Main Graphics is offering a comprehensive suite of large format print products that cover a wide range of business needs. These include indoor and outdoor banners, vinyl and mesh signage, wall and floor graphics, posters, foam core and PVC boards, trade show displays, pop-up signage, and vehicle decals. From simple promotional posters to complex event packages, Main Graphics provides expert support throughout the process—from design consultation and material selection to finishing, packaging, and local delivery.
The company also understands that turnaround time is often critical for large format jobs, especially for events and time-sensitive promotions. Thanks to the upgraded workflow, Main Graphics can now complete many large format jobs in significantly less time, offering same-day or next-day turnaround on select products without sacrificing precision or durability.
“Our clients count on us to be reliable partners,” the representative added. “By upgrading our large format operations, we’re not just increasing our output—we’re also enhancing the flexibility, speed, and attention to detail we bring to every project. That’s what sets us apart.”
Another key component of the expansion is Main Graphics’ commitment to sustainability. The company uses eco-friendly inks and recyclable materials whenever possible, helping clients meet their own environmental goals while still producing standout visual materials. This approach aligns with the values of many modern organizations that prioritize sustainable practices in their supply chain and vendor relationships.
Main Graphics has also made it easier for businesses to collaborate on large format print projects. The company’s dedicated team of print specialists works closely with each client to ensure color accuracy, material suitability, and proper file preparation. Whether a client is printing one large banner or hundreds of event signs, the process is streamlined, communicative, and focused on delivering exactly what’s needed.
With this service enhancement, Main Graphics is better equipped than ever to support businesses throughout Orange County with professional, cost-effective large format printing. The expansion reflects the company’s continued growth and its commitment to investing in solutions that make an impact—both for clients and the communities they serve.
“In a visually driven world, print is more important than ever,” the representative concluded. “We’re excited to bring more capabilities, more speed, and more creative solutions to the businesses that rely on us.”
PLANO, TX / ACCESS Newswire / August 6, 2025 / BGSF, Inc. (NYSE:BGSF), a leading provider of workforce solutions through the Property Management segment, today reported financial results for the second fiscal quarter ended June 29, 2025.
Q2 2025 Highlights from Continuing Operations (results include sequential comparisons to Q1 2025):
Revenues were $23.5 million for Q2, compared to $20.9 million for Q1 . The 12.6% increase from Q1 is primarily driven by increased billed hours from seasonal demand.
Gross profit was $8.4 million for Q2, up from $7.6 million in Q1, primarily due to higher sales.
Net loss was $4.9 million, or $0.44 per diluted share for Q2, compared to a net loss of $2.2 million in Q1 or $0.21 per diluted share.
Adjusted EBITDA1 loss was $1.1 million (4.9% of revenues) in Q2 compared to $1.0 million (5.4% of revenues) in Q1.
Adjusted EPS1 loss was $0.19 for Q2, compared with Adjusted EPS1 loss of $0.11 for Q1.
SUMMARY OF FINANCIAL RESULTS FROM CONTINUING OPERATIONS (dollars in thousands) (unaudited)
For the Thirteen Week Periods Ended
June 29, 2025
June 30, 2024
March 30, 2025
Revenues
$
23,506
$
25,726
$
20,883
Gross profit
$
8,410
$
9,596
$
7,560
Gross profit percentage
35.8
%
37.3
%
36.2
%
Operating loss
$
(4,425
)
$
(1,475
)
$
(1,773
)
Net loss
$
(4,862
)
$
(2,082
)
$
(2,245
)
Net loss per diluted share
$
(0.44
)
$
(0.19
)
$
(0.21
)
Non-GAAP Financial Measures:
Adjusted EBITDA1
$
(1,145
)
$
(264
)
$
(1,032
)
Adjusted EBITDA Margin (% of revenue)1
(4.9)
%
(1.0)
%
(5.4)
%
Adjusted EPS1
$
(0.19
)
$
(0.04
)
$
(0.11
)
1 Adjusted EBITDA and Adjusted EPS are non-GAAP financial measures as defined and reconciled below.
Interim Co-Chief Executive Officer, Chief Financial Officer and Secretary, Keith Schroeder, said, “The proposed sale of BGSF’s Professional division to INSPYR is moving along as planned, a proxy statement was filed on July 25th to call for a special meeting of shareholders on September 4th to vote on the transaction. Following the closing of the transaction, we will perform under a Transition Service Agreement, or TSA, for up to six months or longer to help INSPYR stand up the business in their operating environment. We will be paid for those services, and we also plan to continue reducing our overhead costs to align with a smaller, Property Management-focused company. We expect our financial results, post-close, to be noisy for a couple of quarters.”
Interim Co-Chief Executive Officer and Property Management President, Kelly Brown, commented, “Our second quarter Sales from continuing operations, or the Property Management business, of $23.5 million, improved sequentially on seasonality from the first quarter by 12.6%, and declined from last year’s quarter of 8.6%. Gross margins were relatively stable at 35.8% for the second quarter. In addition to implementing cost reduction measures that Keith addressed, we are also re-baselining Property Management costs to align more closely with revenue and investing in strategic initiatives to drive revenue and profitability in our business. Specifically, we are implementing AI-powered sales and recruiting tools that are expected to be operational by the middle of the fourth quarter.”
Conference Call
BGSF will discuss its second quarter 2025 financial results during a conference call and webcast at 9:00 a.m. ET on August 7, 2025. Interested participants may dial 1-888-506-0062 (Toll Free) or 1-973-528-0011 (International). A replay of the call will be available until August 21, 2025. To access the replay, please dial 1-877-481-4010 (Toll Free), or 1-919-882-2331 (International) and enter access code 52558. The live webcast and archived replay are accessible from the investor relations section of the Company’s website at https://investor.bgsf.com/events-and-presentations/default.aspx
About BGSF
BGSF provides consulting, managed services and professional workforce solutions to a variety of industries through its various divisions in IT, Finance & Accounting, Managed Solutions, and Property Management. BGSF has integrated several regional and national brands achieving scalable growth. The Company was ranked by Staffing Industry Analysts as the 97th largest U.S. staffing company and the 49th largest IT staffing firm in 2024. The Company’s disciplined acquisition philosophy, which builds value through both financial growth and the retention of unique and dedicated talent within BGSF’s family of companies, has resulted in a seasoned management team with strong tenure and the ability to offer exceptional service to our field talent and client partners while building value for investors. For more information on the Company and its services, please visit its website at www.bgsf.com.
Previously Announced Equity Purchase Agreement
On June 16, 2025, BGSF announced that it had signed a definitive agreement to sell its Professional Division to INSPYR Solutions (“INSPYR”). The proposed transaction is subject to the satisfaction of customary closing conditions, including but not limited to the approval of BGSF’s stockholders. For additional information associated with the transaction, please see BGSF’s filings from time to time with the Securities and Exchange Commission.
Forward-Looking Statements
This press release contains forward-looking statements within the meaning of U.S. federal securities laws. Such forward-looking statements include, but are not limited to, statements regarding the proposed transaction, obtaining customary shareholder approval, satisfying closing conditions, the closing, including its timing, of the sale of BGSF, Inc.’s Professional Division, the use of proceeds of the sale, the projected operational and financial performance of BGSF and its various subsidiaries, including following the sale of BGSF’s Professional Division, its offerings of services and solutions and developments and reception of its services and solutions by client partners, and BGSF’s expectations, hopes, beliefs, intentions, plans, prospects, or strategies regarding the future revenue and the business plans of BGSF’s management team. Any statements contained herein that are not statements of historical fact may be deemed to be forward-looking statements. In addition, any statements that refer to projections, forecasts, or other characterizations of future events or circumstances, including any underlying assumptions, are forward-looking statements. The words “anticipate,” “believe,” “continue,” “could,” “endeavor,” “estimate,” “expect,” “intends,” “may,” “might,” “plan,” “possible,” “potential,” “predict,” “project,” “should,” “will,” “would,” and similar expressions may identify forward-looking statements, but the absence of these words does not mean that a statement is not forward-looking. The forward-looking statements contained in this press release are based on certain assumptions and analyses made by the management of BGSF considering their respective experience and perception of historical trends, current conditions, and expected future developments and their potential effects on BGSF as well as other factors they believe are appropriate in the circumstances. There can be no assurance that future developments affecting BGSF will be those anticipated. These forward-looking statements involve a number of risks, uncertainties (some of which are beyond the control of the parties), or other assumptions that may cause actual results or performance to be materially different from those expressed or implied by these forward-looking statements, including the closing conditions for the sale of BGSF’s Professional Division not being satisfied, the ability of the parties to close the transaction on the expected closing timeline or at all, the nature, cost, or outcome of any legal proceedings relating to the transaction, the impact of the contemplated transaction on our stock price, the ability of BGSF to service or otherwise pay its debt obligations, including in the event the closing does not occur, the mix of services or solutions utilized by BGSF’s client partners and such client partners’ needs for these services or solutions, market acceptance of new offerings of services or solutions, the ability of BGSF to expand what it does for existing client partners as well as to add new client partners, whether BGSF will have sufficient capital to operate as anticipated, the impact the transaction or its announcement may have on BGSF’s operations, team members, field talent, client partners, and other constituents, the demand for BGSF’s services and solutions, economic activity in BGSF’s industry and in general, and certain risks, uncertainties, and assumptions described in BGSF’s most recently filed Annual Report on Form 10-K and subsequently filed Quarterly Reports on Form 10-Q under the heading “Risk Factors.” Should one or more of these risks or uncertainties materialize or should any of the assumptions being made prove incorrect, actual results may vary in material respects from those projected in these forward-looking statements. BGSF undertakes no obligation to update or revise any forward-looking statements, whether because of new information, future events, or otherwise, except as may be required under applicable securities laws.
Additional Information About the Equity Purchase Agreement and Where to Find It
In connection with the proposed transaction, BGSF filed with the Securities and Exchange Commission (the “SEC”) on July 25, 2025 a definitive proxy statement and other relevant documents, and mailed to BGSF’s shareholders a definitive proxy statement and other relevant documents on or about August 5, 2025. BEFORE MAKING ANY VOTING DECISION, BGSF’S SHAREHOLDERS ARE URGED TO READ THE DEFINITIVE PROXY STATEMENT IN ITS ENTIRETY AND ANY OTHER DOCUMENTS FILED WITH THE SEC IN CONNECTION WITH THE PROPOSED TRANSACTION OR INCORPORATED BY REFERENCE IN THE DEFINITIVE PROXY STATEMENT BECAUSE THEY CONTAIN IMPORTANT INFORMATION ABOUT THE PROPOSED TRANSACTION AND THE PARTIES TO THE PROPOSED TRANSACTION. Investors and shareholders may obtain a free copy of documents filed by BGSF with the SEC at the SEC’s website at www.sec.gov. In addition, investors and shareholders may obtain a free copy of BGSF’s filings with the SEC from BGSF’s website at https://investor.bgsf.com/financials/sec-filings/default.aspx, or by sending a written request to BGSF’s Corporate Secretary at our principal executive offices at 5850 Granite Parkway, Suite 730, Plano, Texas 75024.
Participants in the Solicitation
This communication is not a solicitation of proxies in connection with the proposed transaction. BGSF, its directors, and certain of its executive officers and employees may be deemed to be participants in soliciting proxies from its shareholders in connection with the proposed transaction. Information regarding BGSF’s directors and executive officers is contained in the most recent Annual Report on Form 10-K filed with the SEC. More detailed information regarding the identity of potential participants in the solicitation of BGSF’s shareholders in connection with the proposed transaction, and their direct or indirect interests, by securities, holdings, or otherwise, is set forth in the definitive proxy statement and other materials relating to the proposed transaction filed with the SEC. You may obtain free copies of these documents using the sources indicated above in Additional Information and Where to Find It.
CONTACT:
Steven Hooser or Sandy Martin Three Part Advisors ir@BGSF.com 214.872.2710 or 214.616.2207
CONSOLIDATED BALANCE SHEETS (in thousands, except share amounts)
2025
2024
(unaudited)
(audited)
ASSETS
Current assets
Cash and cash equivalents
$
2,777
$
32
Accounts receivable (net of allowance for credit losses of $1,156 and $910, respectively)
13,637
17,148
Prepaid expenses
1,687
1,600
Other current assets
2,029
2,213
Current assets of discontinued operations
27,473
24,354
Total current assets
47,603
45,347
Property and equipment, net
299
608
Other assets
Deposits
1,996
2,003
Software as a service, net
3,651
4,068
Deferred income taxes, net
9,227
7,849
Right-of-use asset – operating leases, net
856
1,083
Intangible assets, net
3,911
4,385
Goodwill
1,074
1,074
Noncurrent assets of discontinued operations
81,075
83,694
Total other assets
101,790
104,156
Total assets
$
149,692
$
150,111
LIABILITIES AND STOCKHOLDERS’ EQUITY
Current liabilities
Accounts payable
$
1,368
$
80
Accrued payroll and expenses
7,086
4,868
Long-term debt, current portion (net of debt issuance costs of $18 and $24, respectively)
3,807
3,801
Accrued interest
510
223
Income taxes payable
295
212
Convertible note
4,368
4,368
Lease liabilities, current portion
474
544
Current liabilities of discontinued operations
11,093
11,825
Total current liabilities
29,001
25,921
Line of credit (net of debt issuance costs of $256 and $770, respectively)
7,744
5,625
Long-term debt, less current portion (net of debt issuance costs of $149 and $198, respectively)
30,664
32,527
Lease liabilities, less current portion
506
698
Noncurrent liabilities of discontinued operations
3,491
3,071
Total liabilities
71,406
67,842
Commitments and contingencies
Preferred stock, $0.01 par value per share, 500,000 shares authorized, -0- shares issued and outstanding
–
–
Common stock, $0.01 par value per share; 19,500,000 shares authorized 11,158,828 and 11,038,623 shares issued and outstanding, respectively, net of 3,930 shares of treasury stock, at cost, respectively.
55
53
Additional paid in capital
70,733
70,260
Retained earnings
7,498
11,956
Total stockholders’ equity
78,286
82,269
Total liabilities and stockholders’ equity
$
149,692
$
150,111
UNAUDITED CONSOLIDATED STATEMENTS OF OPERATIONS (in thousands, except per share and dividend amounts)
For the Thirteen and Twenty-six Week Periods Ended June 29, 2025 and June 30, 2024
Thirteen Weeks Ended
Twenty-six Weeks Ended
2025
2024
2025
2024
Revenues
$
23,506
$
25,726
$
44,389
$
50,273
Cost of services
15,096
16,130
28,419
31,334
Gross profit
8,410
9,596
15,970
18,939
Selling, general, and administrative expenses
12,576
10,739
21,580
21,001
Depreciation and amortization
259
332
588
671
Operating loss
(4,425
)
(1,475
)
(6,198
)
(2,733
)
Interest expense, net
(1,829
)
(1,105
)
(2,931
)
(2,386
)
Loss from continuing operations before income taxes
(6,254
)
(2,580
)
(9,129
)
(5,119
)
Income tax benefit from continuing operations
1,392
498
2,031
989
Net loss from continuing operations
(4,862
)
(2,082
)
(7,098
)
(4,130
)
Income from discontinued operations:
Income from discontinued operations
1,309
1,601
3,377
3,319
Income tax expense
(183
)
(280
)
(737
)
(742
)
Net loss
$
(3,736
)
$
(761
)
$
(4,458
)
$
(1,553
)
Net (loss) income per share – basic:
Net loss from continuing operations
$
(0.44
)
$
(0.19
)
$
(0.65
)
$
(0.38
)
Net income from discontinued operations:
Income
0.12
0.15
0.31
0.31
Income tax expense
(0.02
)
(0.03
)
(0.07
)
(0.07
)
Net loss per share – basic
$
(0.34
)
$
(0.07
)
$
(0.41
)
$
(0.14
)
Net (loss) income per share-diluted:
Net loss from continuing operations
$
(0.44
)
$
(0.19
)
$
(0.65
)
$
(0.38
)
Net income from discontinued operations:
Income
0.12
0.15
0.31
0.31
Income tax expense
(0.02
)
(0.03
)
(0.07
)
(0.07
)
Net loss per share – diluted
$
(0.34
)
$
(0.07
)
$
(0.41
)
$
(0.14
)
Weighted-average shares outstanding:
Basic
11,019
10,880
10,986
10,858
Diluted
11,019
10,880
10,986
10,858
Cash dividends declared per common share
$
–
$
–
$
–
$
0.15
PROPERTY MANAGEMENT SEGMENT (dollars in thousands)
Thirteen Weeks Ended
Twenty-six Weeks Ended
June 29, 2025
June 30, 2024
June 29, 2025
June 30, 2024
Contract field talent
$
23,000
$
25,272
$
43,279
$
49,332
Contingent placements
506
454
1,110
941
Revenue
23,506
25,726
44,389
50,273
Compensation and related
15,058
16,090
28,344
31,254
Other
38
40
75
80
Gross profit
8,410
9,596
15,970
18,939
Selling:
Compensation
4,195
4,771
8,121
9,321
Advertising, occupancy, and travel
447
564
825
908
Software, insurance, and professional fees
296
336
669
632
Other
1,806
674
2,176
1,374
Contributions to overhead
1,666
3,251
4,179
6,704
General and administrative:
Compensation
2,184
2,365
4,245
4,678
Software
828
590
1,525
1,226
Professional fees
569
482
1,111
932
Strategic alternatives review
1,613
280
1,634
349
Other
638
677
1,273
1,580
Depreciation and amortization
259
332
588
671
Operating loss
(4,425
)
(1,475
)
(6,197
)
(2,732
)
Interest expense, net
(1,829
)
(1,105
)
(2,931
)
(2,386
)
Income tax benefit from continuing operations
1,392
498
2,031
989
Net loss from continuing operations
$
(4,862
)
$
(2,082
)
$
(7,097
)
$
(4,129
)
Capital expenditures
$
13
$
432
$
13
$
863
Total assets
$
41,881
$
50,240
$
41,881
$
50,240
UNAUDITED CONSOLIDATED STATEMENTS OF CASH FLOWS (in thousands)
For the Twenty-six Week Periods Ended June 29, 2025 and June 30, 2024
2025
2024
Cash flows from operating activities
Net loss
$
(4,458
)
$
(1,553
)
Net income from discontinued operations
(2,640
)
(2,577
)
Adjustments to reconcile net loss to net cash provided by activities:
Depreciation
58
83
Amortization
530
588
Software as a service
425
328
Loss on disposal of property and equipment
6
–
Amortization of debt issuance costs
598
89
Provision for credit losses
1,656
1,016
Share-based compensation
305
439
Deferred income taxes, net of acquired deferred tax liability
(1,378
)
1,436
Net changes in operating assets and liabilities:
Accounts receivable
1,851
5,948
Prepaid expenses
(87
)
616
Other current assets
(393
)
820
Deposits
8
593
Accounts payable
1,288
160
Accrued payroll and expenses
3,263
(867
)
Accrued interest
287
(218
)
Income taxes receivable
(384
)
(771
)
Other current liabilities
–
2,116
Operating leases
(33
)
(33
)
Net cash provided by continuing operating activities
2,962
14,585
Net cash provided by discontinued operating activities
253
132
Net cash provided by operating activities
3,215
14,717
Cash flows from investing activities
Capital expenditures
(13
)
(863
)
Net cash used in continuing investing activities
(13
)
(863
)
Net cash used in discontinued investing activities
(63
)
(132
)
Net cash used in investing activities
(76
)
(995
)
Cash flows from financing activities
Net borrowings (payments) under line of credit
1,604
(10,808
)
Principal payments on long-term debt
(1,913
)
(850
)
Payments of dividends
–
(1,639
)
Issuance of ESPP shares
134
244
Issuance of shares under the 2013 Long-Term Incentive Plan
–
102
Payments of debt issuance costs
(29
)
(545
)
Net cash used in continuing financing activities
(204
)
(13,496
)
Net change in cash and cash equivalents of continuing operations
2,745
226
Cash and cash equivalents, beginning of period
32
–
Cash and cash equivalents, end of period
$
2,777
$
226
Supplemental cash flow information:
Cash paid for interest, net
$
1,950
$
2,417
Cash paid for taxes, net of refunds
$
739
$
636
NON-GAAP FINANCIAL MEASURES
The financial results of BGSF, Inc. are prepared in conformity with accounting principles generally accepted in the United States of America (“GAAP”) and the rules of the U.S. Securities and Exchange Commission. To help the readers understand our financial performance, we supplements our GAAP financial results with Adjusted EBITDA and Adjusted EPS.
A non-GAAP financial measure is a numerical measure of a company’s financial performance that excludes or includes amounts so as to be different than the most directly comparable measure calculated and presented in accordance with GAAP in the statement of income, balance sheet or statement of cash flows of a company. Adjusted EBITDA and Adjusted EPS are not measurements of financial performance under GAAP and should not be considered as alternatives to net income, net income per diluted share, operating income, or any other performance measure derived in accordance with GAAP, or as alternatives to cash flow from operating activities or measures of our liquidity. We believe that Adjusted EBITDA and Adjusted EPS are useful performance measures and are used by us to facilitate a comparison of our operating performance on a consistent basis from period-to-period and to provide for a more complete understanding of factors and trends affecting our business than measures under GAAP can provide alone. In addition, the financial covenants in our credit agreement are based on EBITDA as defined in the credit agreement.
We define “Adjusted EBITDA” as earnings before interest expense, income taxes, depreciation and amortization expense, costs associated with the evaluation of potential strategic alternatives (“strategic alternatives review”), software as a service costs, and certain non-cash expenses such as share-based compensation expense, as well as certain specific events that management does not consider in assessing our on-going operating performance.
We define “Adjusted EPS” as diluted earnings per share eliminating amortization expense of intangible assets from acquisitions, the strategic alternatives review, software as a service costs, and certain non-cash expenses such as share-based compensation expense, as well as certain specific events that management does not consider in assessing our on-going operating performance, net of the respective income tax effect.
Reconciliation of Net Loss to Adjusted EBITDA (dollars in thousands)
Thirteen Weeks Ended
Twenty-six Weeks Ended
Thirteen Weeks Ended
June 29, 2025
June 30, 2024
June 29, 2025
June 30, 2024
March 30, 2025
Net loss from continuing operations
$
(4,862
)
$
(2,082
)
$
(7,098
)
$
(4,130
)
$
(2,245
)
Income tax benefit
(1,392
)
(498
)
(2,031
)
(989
)
(630
)
Interest expense, net
1,829
1,105
2,931
2,386
1,102
Operating loss
(4,425
)
(1,475
)
(6,198
)
(2,733
)
(1,773
)
Depreciation and amortization
259
332
588
671
329
Share-based compensation
137
220
305
439
168
Strategic alternatives review
1,613
280
1,634
349
20
Software as a service2
291
180
425
328
134
Aged receivable adjustment
980
199
1,070
324
90
Adjusted EBITDA from continuing operations
(1,145
)
(264
)
(2,176
)
(622
)
(1,032
)
Adjusted EBITDA Margin (% of revenue)
(4.9)
%
(1.0)
%
(4.9)
%
(1.2)
%
(5.4)
%
Income from discontinued operations
1,126
1,321
2,640
2,577
1,522
Adjustments to discontinued operations
1,142
1,901
3,090
4,001
1,405
Adjusted EBITDA from discontinued operations
2,268
3,222
5,730
6,578
2,927
Adjusted EBITDA, net
$
1,123
$
2,958
$
3,554
$
5,956
$
1,895
2 We capitalize direct costs incurred in cloud computing implementation from hosting arrangements, which are reported as a Software as a service and are expensed as incurred in selling, general, and administrative expenses.
Reconciliation of Net Loss EPS to Adjusted EPS
Thirteen Weeks Ended
Twenty-six Weeks Ended
Thirteen Weeks Ended
June 29, 2025
June 30, 2024
June 29, 2025
June 30, 2024
March 30, 2025
Net loss from continuing operations per diluted share
$
(0.44
)
$
(0.19
)
$
(0.65
)
$
(0.38
)
$
(0.21
)
Income tax benefit
(0.13
)
(0.05
)
(0.18
)
(0.09
)
(0.06
)
Interest expense, net
0.17
0.10
0.27
0.22
0.10
Operating loss
(0.40
)
(0.14
)
(0.56
)
(0.25
)
(0.17
)
Depreciation and amortization
0.02
0.03
0.05
0.06
0.03
Share-based compensation
0.01
0.02
0.03
0.04
0.02
Strategic alternatives review
0.15
0.03
0.15
0.03
–
Software as a service2
0.03
0.02
0.04
0.03
0.01
Adjusted EPS from continuing operations
(0.19
)
(0.04
)
(0.29
)
(0.09
)
(0.11
)
Adjusted EPS from discontinued operations
0.21
0.29
0.52
0.60
0.27
Adjusted EPS
$
0.02
$
0.25
$
0.23
$
0.51
$
0.16
2 We capitalize direct costs incurred in cloud computing implementation from hosting arrangements, which are reported as a Software as a service and are expensed as incurred in selling, general, and administrative expenses.